Civic Insights: Who Pays for that Pipe, Part IV
(City council, school board, planning commission, county commissioners – these groups and several others represent us. They do the day to day work of running our community. It is our responsibility to keep informed about their work so that we can help them represent us effectively. “Civic Insights” by Jeffrey Vitarius is a regular feature of Act Locally Waco. Its purpose is to help us understand decisions that shape our community so that we can participate effectively as informed, engaged residents of Waco. – ALW)

By Jeffrey Vitarius
Back in September, we began this series with a broad look at what an impact fee policy is. A month ago, we focused on the legal process for establishing an impact fee. Two weeks ago, we took a look at pipe-related details of the report that serves as the basis for any impact fee policy in Waco. This week, we’ll take a look at the road side of things. Then we will wrap up next week, by looking at the policy the City considered on October 20th.
As a bit of reminder, we are working our way through the following steps that were used to calculate maximum impact fees:
- Determine a service area
- Identify a way to connect demand for service to supply for service
- Calculate increased demand for services
- Review existing supply for services
- Determine and cost projects needed to meet increased demand
- Identify service unit to divide costs amongst projects
- Calculate maximum impact fees
1. Service Area
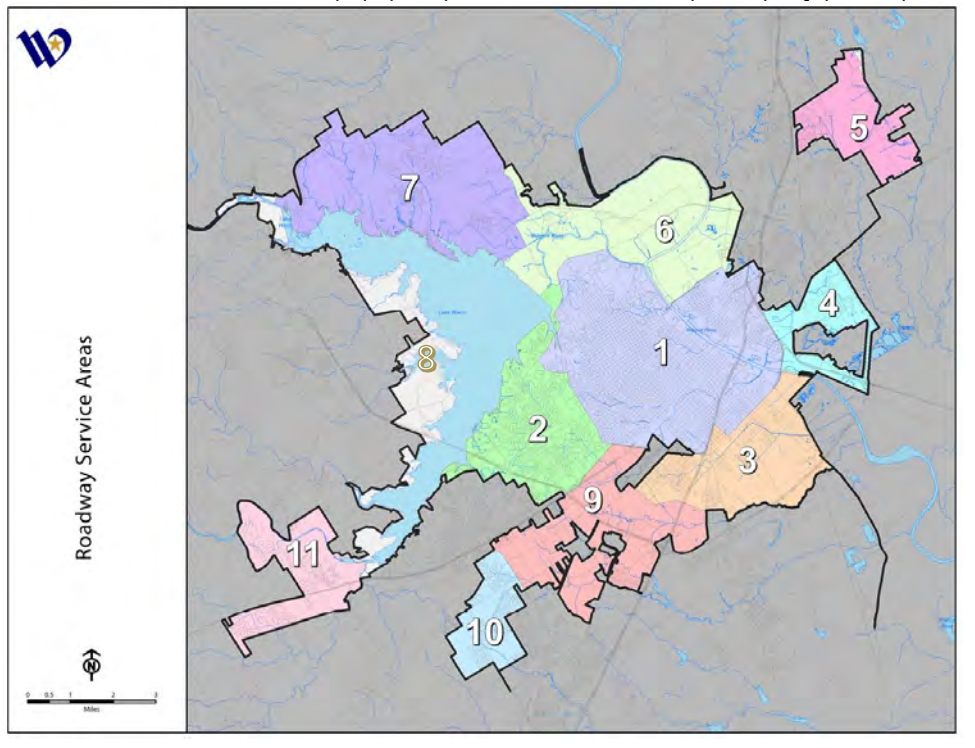
As you may recall from two weeks ago, service areas are the geographic boundaries of the impact fee policy. Chapter 395 provides guidance on what these areas can be or must be. For roads, there is a unique limitation that is not applied to pipes. Service areas for roads are limited to about twelve miles across (technically a six-mile radius). The reasoning here is that one part of town should not have to pay for the roads of a different part of town. For pipes the network is considered as a united system, whereas with roads smaller service areas are required. Additionally, a service area for roads cannot extend beyond the city limits (excluding the Extra-Terratorial Jurisdiction).
How these twelve mile “areas” are drawn is left up to the city or county looking to begin impact fees. For Waco the service areas ended up as this map:

2. Connecting Demand and Supply
We will once again need to find some measurement to connect a new house or business park (demand) to the existing system of roads and any potential expansions (supply). The measurement needs to be scalable to the variety of demands that will come from new development and be measurable for distinct projects and supply systems. For roads, that measure is vehicle-mile at the PM peak hour. That probably needs some unpacking.
In thinking about the kind of measure we need here, the first impulse might be to simply count the cars. How many vehicles use the road system at any given point in time? That would get us part of the way there, but would miss a critical question: how far are those cars going? A car going a couple miles to a local restaurant “uses” substantially less roadway than a car going ten miles to work.
So we need to know not only how many cars are out there, but how far all of them are going. That is how we get to vehicle-miles. Ten cars going one mile has the same “vehicle miles” as one care going ten miles (10 cars x 1 mile = 10 vehicle-miles vs 1 car x 10 miles = 10 vehicle-miles).
On top of this, roadway use changes throughout the day, much like pipes (diurnal patterns). Road use peaks in the AM and the PM rush hours with less use in between. So, for the sake of impact fees the PM peak hour is used to measure vehicle-miles.
3. Increased Demand
Projecting how much Waco will grow overall, and where that growth will occur follows the exact same pattern that was used for pipes. For roads, however, a simple breakdown between growth in residents and employees will not be enough to fully capture the impact on roadways. For roads, the kind of employment becomes important.
We can see this if we think about the differences between a small industrial center and a retail park. Both may hire the same number of employees, but they generate substantially different vehicle-miles. At the industrial center, employees arrive and leave plus the occasional shipment of goods. However, at the retail center not only do you have employees and shipments coming and going, you also have customers.
To account for this our consultants, Freese and Nichols, broke employment growth down into basic, retail, and service categories. Each of these have a different impact on vehicle-miles. They then translated the number of new employees into anticipated square feet of use and bridged from that measure into vehicle-miles. For new residents, they looked at growth on a residences (rather than residents) basis.
Combining all this together they were able to project increased vehicle-mile demand for each of the service areas over the next ten years.
4. Existing Supply and 5. New Projects
A factor of particular importance in looking at how the current roadways will be able to accommodate the increased pressures of growth is how much are they currently being used. Pipes are metered. Water users are billed based on how much demand they put on the current systems. So it is fairly simple to gather information about current use. Roads are different. Their use is not tracked nearly as closely. For the sake of this study, Freese and Nichols relied on traffic counts that were collected on thirty separate locations across the city in May of 2019.
They then compared these counts to the traffic capacity of various road segments (think of these as the bits of road where the road stays the same, so the part of x drive that has four lanes is separated from the part that has two lanes). Capacity can normally be determined by looking at the design of the road. On a really rough level, you can see that I-35 has more capacity than Waco Drive which has more capacity than 10th Street. So looking at the current use and the design capacity of each roadway you can figure how many additional vehicle miles you can add in without needing to change the road (incidentally there are some roads that are already used more than their capacity, these “deficits” are ultimately taken out of the calculation of improvement cost since they are not a result of new demand).
Much like with pipes, Freese and Nichols along with City Staff then identified a number of improvements that might be eligible for impact fee funding. Unlike pipes, these projects were assigned to specific service areas. Where a project crossed the boundary between two service areas, its costs were split between the two. These projects were then examined for the amount of vehicle-mile capacity they added to the service area. So long as this added capacity was less than the increased demand in that service area (see step 3) the entire cost of the projects for that area could be included in the impact fee calculation. Where the added capacity was more than the increased demand, only that portion of the projects that covered the increased demand could be considered.
Combining all the allowable costs together, the report then applies the same 50% credit to the costs that we discussed with pipes. At the end of this process we have the total eligible impact fee cost – the total cost of increased capacity due to new demand after consideration of a credit for future taxes for each service area.
6. Service Unit
Chapter 395 calls for the establishment of a service unit specifically. It defines this (in broad terms) as a standardized measure of use. Although vehicle-miles remain a good connector between supply and demand, it is difficult to determine the exact number of vehicle-miles any given development would generate. So, the study scales vehicle-miles on the basis of a single-family residence. Basically, we look at each development in terms of how it relates to the demand generated by a single-family residence.
As was mentioned above, in general you can calculate the vehicle-miles produced by any given development based on its characteristics. We look at this in terms ultimately of trip total trip length. That is the number of vehicle-miles generated by the development. There are a number of interesting factors that go into this calculation (like trip generation, individual trip length, adjustments for diverted trips and local conditions), but we don’t have the space to get into all of these here. Instead we can go with a nice round number example. Let’s assume a single-family residence produces 4 miles of adjusted trip length and a retail store produces 12. The retail store will be scaled so that it can be measured as a multiple of a single family residence. With this example that multiple is 3 (12 divided by 4).
Here are some of the real ratios to give you an idea of how they work in the study. A hospital is anticipated to generate 1.72 times the demand of a single-family residence for every 1,000 square feet it contains. A clinic, in contrast, generates 5.81 times the demand of a single-family residence for every 1,000 square feet. These ratios allow for the generation of a comprehensible unit of measure to distribute the costs of the improvements.
7. Maximum Impact Fee
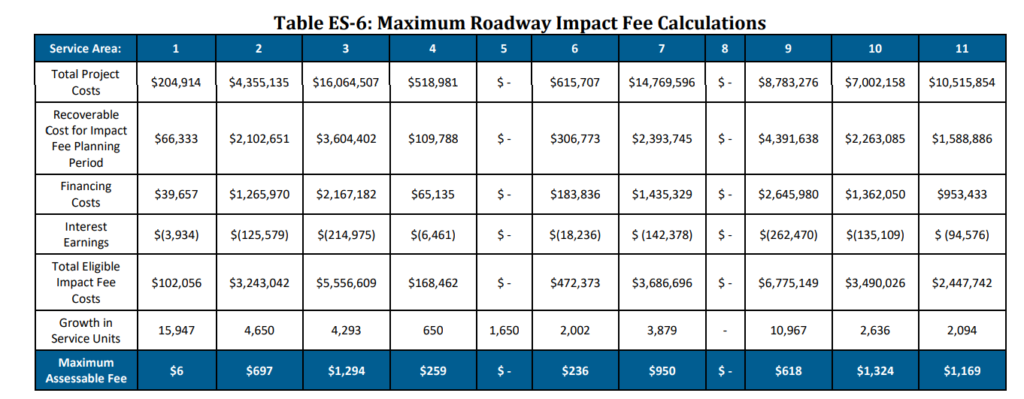
Knowing our service unit and our total eligible costs, the final step can be taken. A projection is made of the total new service units anticipated by development (for roads this projection relies heavily on land use assumptions since different kinds of development vary greatly in terms of trip generation). This projection is made on the basis of the service areas we noted above. For example, service area five as zero anticipated growth in service units. Whereas, service area one anticipates 15,947 new single-family resident equivalents. The chart below completes the process.

Here we see that after all these steps the maximum impact fee allowable by law for roads in service area one is $6 and for service area eleven is $1,169. These numbers are the final product of that could process we discussed at the very beginning of all of this. That is the process to determine what impact fees could be (as opposed to should be). Whatever the outcome of the should process is, the impact fees cannot exceed these amounts for a single-family residence equivalent.

Jeffrey Vitarius has been actively local since early 2017. He lives in Sanger Heights with partner (JD) and his son (Callahan). He helped found Waco Pride Network and now serves as that organization’s treasurer and Pride Planning Chair. Jeffrey works at City Center Waco where he helps keep Downtown Waco clean, safe, and vibrant. He is a member of St. Alban’s Episcopal Church and graduated from Baylor in 2011.
The Act Locally Waco blog publishes posts with a connection to these aspirations for Waco. If you are interested in writing for the Act Locally Waco Blog, please email [email protected]for more information.
