
Waco residents have a variety of opportunities to connect with the environment and their community this spring through a series of Earth Month events. Activities throughout April focus on conservation, education and volunteerism, offering options for all ages and interests.

Act Locally Waco With Waco Walks
Waco Walks will host a guided nature walk Saturday, April 25, at 9 a.m. at the Carleen Bright Arboretum, 9001 Bosque Blvd., in Woodway, where participants will meet in front of the Whitehall Center. Led by Heart of Texas Master Naturalists Aaron Lincoln and Randy King, the walk will explore the Arboretum’s gardens, groves and trails, with discussion focused on native plants, wildflowers and local wildlife, including birds and insects. The walk is approximately 1.5 miles and includes a mix of paved and gravel surfaces. Participants are encouraged to bring water and wear appropriate footwear, especially if there has been recent rain. Parking is available at the Pavilion at the Arboretum, Woodway City Hall and the Woodway Family Center. Dogs are allowed but must remain on a leash and follow Arboretum rules. The walk will take place rain or shine, and in the event of severe weather or cancellation, updates will be sent via email. For more information, contact Ashley Thornton at [email protected].
Message from Waco-McLennan Public Health:
Earth Day is an opportunity to care for the environment and support a healthier community. Reducing food waste is one simple way to make an impact. Cutting back on waste can help save money, ensure more people have access to food and contribute to a cleaner, more sustainable environment.
One way to reduce food waste is to better understand what “best by” labels actually mean, as they refer to food quality rather than safety. Labels such as “best if used by/before” indicate when a product will taste its best but do not mean the food is unsafe to eat afterward. A “sell by” date is intended for retailers to manage inventory and does not determine safety for consumers, while a “use by” date reflects peak quality and is generally not related to food safety, except in the case of infant formula, which should not be used after that date.
According to Waco-McLennan Public Health, 5.7 million tons of food were wasted in Texas in 2022, and individuals in the United States waste an average of $759 per year on uneaten food. More information is available at www.fsis.usda.gov as part of the Live Well Waco McLennan County initiative.

Information from Keep Waco Beautiful:
Keep Waco Beautiful is offering multiple ways for residents to get involved in Earth Month efforts across the city. Individuals can sign up to clean a pre-selected Great Waco Cleanup site or participate in a collaborative cleanup April 25 at the South Waco Library. Each spring, designated cleanup locations are selected throughout Waco to encourage community participation. Supplies are provided, allowing volunteers to make an impact simply by showing up. A full list of cleanup sites is available online.
In addition to cleanup efforts, Keep Waco Beautiful is partnering with the City of Waco Parks and Recreation Department to host Arbor Day activities April 24, including a tree planting event at the Waco STEAM Center from 9 to 11 a.m. Registration is required for participation.
The organization is also promoting a digital “Explore Waco’s Green Businesses” passport, which offers discounts at select local businesses. The free passport can be accessed through a web browser and will feature Earth Week specials from April 20 through April 24.
Throughout the month, youth-created upcycled sculpture displays will be on view across Waco from March 21 through April 25. The displays, created using repurposed materials, follow the theme “Our Water, Our Future: Creating Beauty from Waste” and are located at libraries, the Waco STEAM Center and other sites.
These activities are part of the broader H2Waco campaign, which highlights water conservation efforts through community programming and public art installations.
The South Waco Library Cleanup will take place April 25 from 9 to 11 a.m. Volunteers of all ages are welcome. Participants should be aware that the area includes nearby traffic, and safety vests are required. The cleanup is part of the Great Waco Cleanup campaign in partnership with Keep America Beautiful and Keep Texas Beautiful. Registration is required.

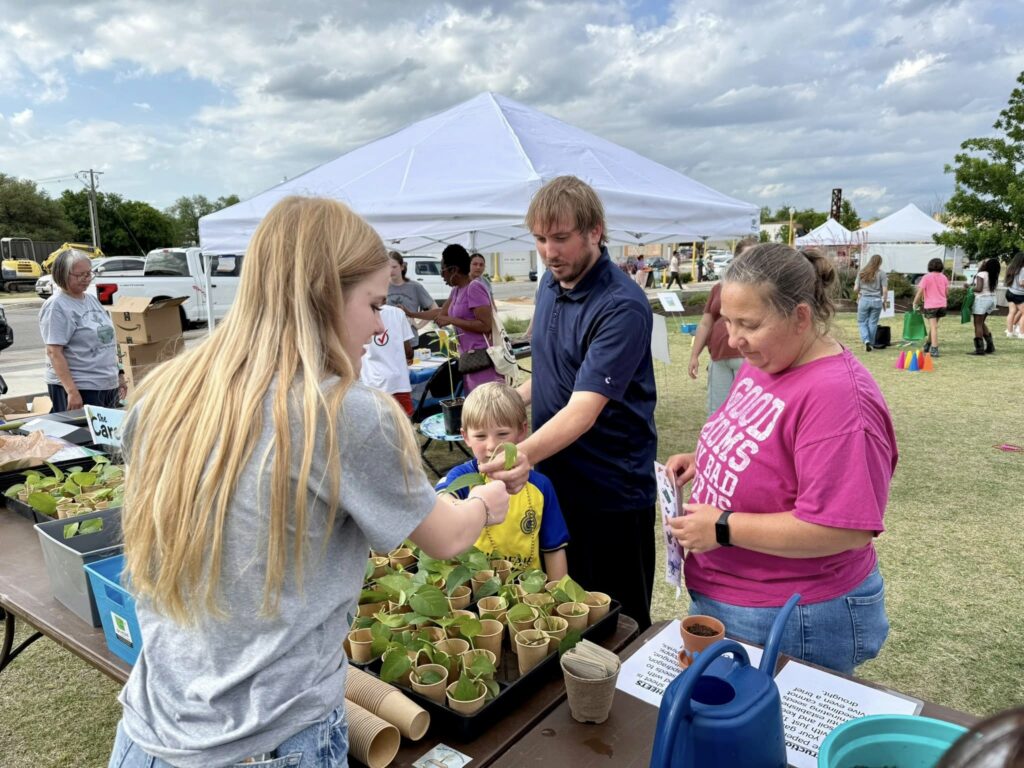
Care for Waco Carnival Waco Farmers Market
The Waco Downtown Farmers Market will host the Care for Waco Carnival this Saturday from 9 a.m. to 1 p.m. as part of ongoing Earth Day celebrations. The event will feature family-friendly games and activities, along with vouchers that can be used at participating food trucks. The event is hosted by the Waco Youth Council and the City of Waco Office of Sustainability and Resiliency. During the market, the City of Waco Beautification, Arts and Culture Division will also host the Waco Tree Canopy Workshop in recognition of National Arbor Day. Participants who previously registered for the workshop and tree giveaway are encouraged to attend.
By: Debbie Wright

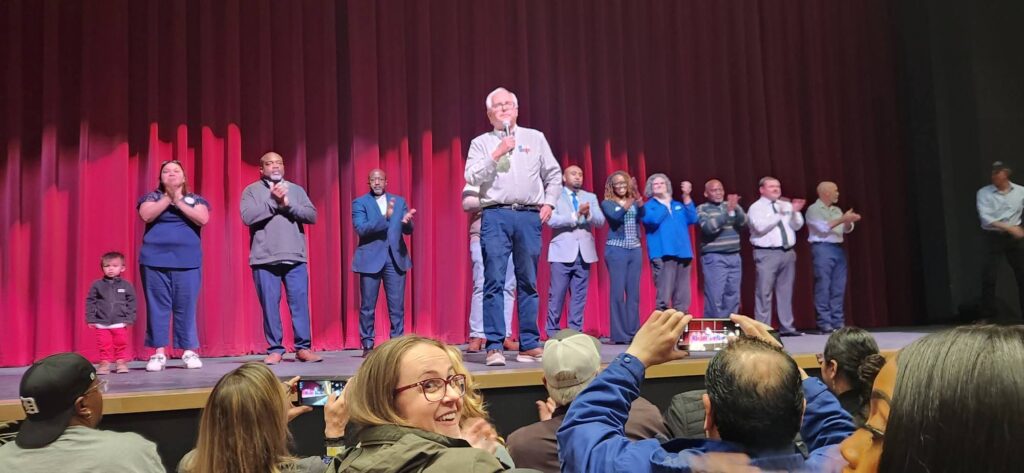
Waco, Tx — Beto O’Rourke spoke to a large audience Tuesday evening in Waco, offering an inspiring and informative address on civic engagement followed by a question-and-answer session.
In his remarks, O’Rourke highlighted that candidates are running for every position on the Texas ballot in the upcoming election cycle, underscoring the breadth of opportunities for voter participation. He encouraged attendees to reflect on pivotal moments in history — from slavery and the Civil War to the Holocaust — and consider how individuals responded during those times and what lessons they might hold for the present.
“Why didn’t someone speak up? Why didn’t they do something? What would I have done?” Beto O’Rourke asked. He said the country is living through a pivotal moment that could shape its future and that people will one day look back and ask what actions were taken, calling it an opportunity to do the right thing.
O’Rourke described the current era as one that may be seen as consequential in hindsight and encouraged people to consider their role in shaping the future. He also acknowledged challenges faced by grassroots campaigns while pointing to recent local election outcomes as examples of the impact of organized civic effort.
A large audience attended the event, many of whom signed up to volunteer with O’Rourke’s civic engagement organization, Powered By People. The evening concluded with an opportunity to meet local and regional candidates.
Lt. Gov. Dan Patrick made a campaign stop in Waco last year and confirmed he intends to seek re-election in 2026; his visit included a discussion of state priorities and legislative issues. Gov. Greg Abbott also recently visited Waco for a State of the State event at the Baylor Club.
Upcoming elections and voting information
Election officials in McLennan County remind residents of several important upcoming dates and ways to participate in the democratic process:
- Joint Primary Election: The Texas primary is scheduled for Tuesday, March 3, 2026. Texas uses an open primary system, and voters may participate in either party’s primary by signing a pledge at the polls. Registering to vote by Feb. 2, 2026, is required to participate in this election.
- City of Waco General Election: Waco’s city council and mayoral general election is set for Saturday, May 2, 2026. Early voting for that election in McLennan County is expected to run from April 20–28, 2026.
- Polling locations: Voters may find vote centers and polling locations throughout McLennan County where they can cast ballots on election days or during early voting periods.
- Voting options: Registered voters may also be eligible to vote by mail if they meet specific criteria. Applications for ballots by mail must be received by the deadline for each election.
Voters should verify their registration status, polling locations and specific ballots through the McLennan County Elections Office or the official Texas election website for current and detailed information.
McLennan County Offices — March 3 and November 3, 2026
Residents in the county will also vote in primary and general elections for several county offices. Key candidates in the March 3 primary (with winners advancing to the November general election) include:
Countywide Positions
- Andy Harwell — McLennan County Clerk (R).
- Rick Tullis — McLennan County Judge (R).
- Josh Tetens — Criminal District Attorney (R).
Precinct Commissioner — Precinct 2
- Jeremy Davis (D)
- Travis Gibson (D)
- Donis Wilson (R)
Constable and Justice of the Peace Races
- Multiple candidates filed for constable and justice of the peace positions across precincts.
These county races affect local governance, public safety, and court functions across McLennan County.
State and Federal Representation Impacting Waco
In addition to local races, McLennan County voters will help choose nominees for statewide and federal offices in the March 3 primary. Some of the candidates in those races include:
- U.S. House — District 17
- Pete Sessions
- Milah Flores
- J. Gordon Mitchell
- Casey Sheppard
- Texas Senate District 22
- David Cook
- Jon Gimble
- Rena Schroader
- Amy Martinez-Salas
- Texas House District 56
- Pat Curry
- Ralph Patterson
- Janessa Givens
- Ashley Bean Thornton
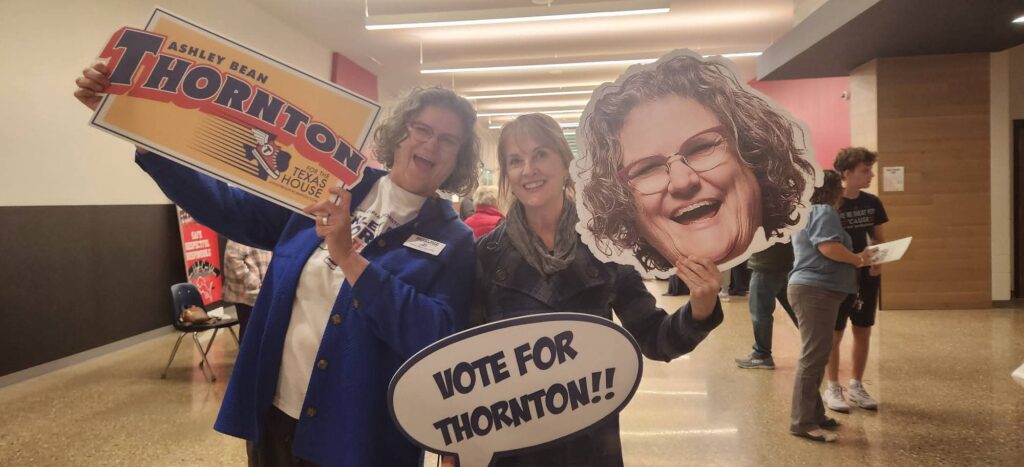
Photos provided by Sherrell Huff
These races determine who will represent Waco area voters in the state legislature and U.S. House of Representatives.
City of Waco — May 2, 2026 Election
Residents will vote for mayor and city council seats in the upcoming municipal election. According to the City of Waco candidate filing list:
- Mayor
- Jim Holmes — incumbent mayor and banker.
- Aiden Morgan — healthcare worker.
- City Council, District 1
- Rachel E. Pate — vice president.
- Andrea J. Barefield — consultant.
- City Council, District 3
- Jed Cole — finance/real estate professional.
These candidates have filed to be on the May 2 city ballot. Early voting is expected to take place in late April, with newly elected officials sworn in after the election.
Residents are encouraged to stay informed, verify their voter registration status and review upcoming election dates and polling locations. Official, up-to-date information for McLennan County voters is available through the McLennan County Elections Office at
https://www.mclennan.gov/337/Elections.
Community members are also encouraged to engage respectfully, seek accurate information and participate in civic processes in ways that align with their values and eligibility.
The Baylor University revised “Animals on Campus Policy” inhibits the feeding of any cats on campus property. Baylor originally issued the “Animals on Campus Policy” in December of 2009, and it was last revised in June of 2023, with the content reportedly being pushed and publicized to students, faculty, and staff in May of 2025. The purpose of this policy is to address the health and safety concerns that animals pose to the campus community, with things such as allergies, disruptions, injuries, disease transmission, and damage to property. Makes sense.
Most of the policy addresses things like service animals in campus classrooms, pets in dormitories, and information about the possible wild animals on campus. However, on page six of the Baylor policy, it states, “For safety, feral cats or loose dogs without owners should be treated with the same caution as a wild animal.” This policy fails to mention pre-existing community cat colonies on campus by not assigning them definitions nor establishing their protections for their current daily habits. If these habits and protections are still in place, Baylor has simply failed to mention it.
I read through the City of Waco’s Municipal Codes, specifically Chapter 5 on ANIMALS, and they define a community cat as any free-roaming cat, regardless of socialization or sociability, cared for by one or more known or unknown residents of the immediate area. Baylor cannot morally, ethically, or legally ask people to stop caring for community cats, when they are recognized as legal entities within city municipalities.
From Chapter 5, Section 129, the City of Waco defines negligent care as failing, refusing, or neglecting to provide any animal in a person’s charge or custody, as owner or otherwise, with proper food, drink, shade, shelter, or veterinary care as may be necessary.

Animal Birth Control of Waco has submitted a proposal to Baylor administration that would allow them to officially manage the campus cat colonies while addressing the university’s concerns about other wildlife. The controversy comes at a particularly sensitive time for the Waco community.
In May, two cats were found shot and hanged from utility lines near the Baylor campus, sparking widespread outrage. Not to mention, Chase the Blue Heeler puppy was just saved from an abusive owner in Lacy Lakeview and is now living with Officer Nathan Rodriguez, who says he “seems very happy in his new home.”
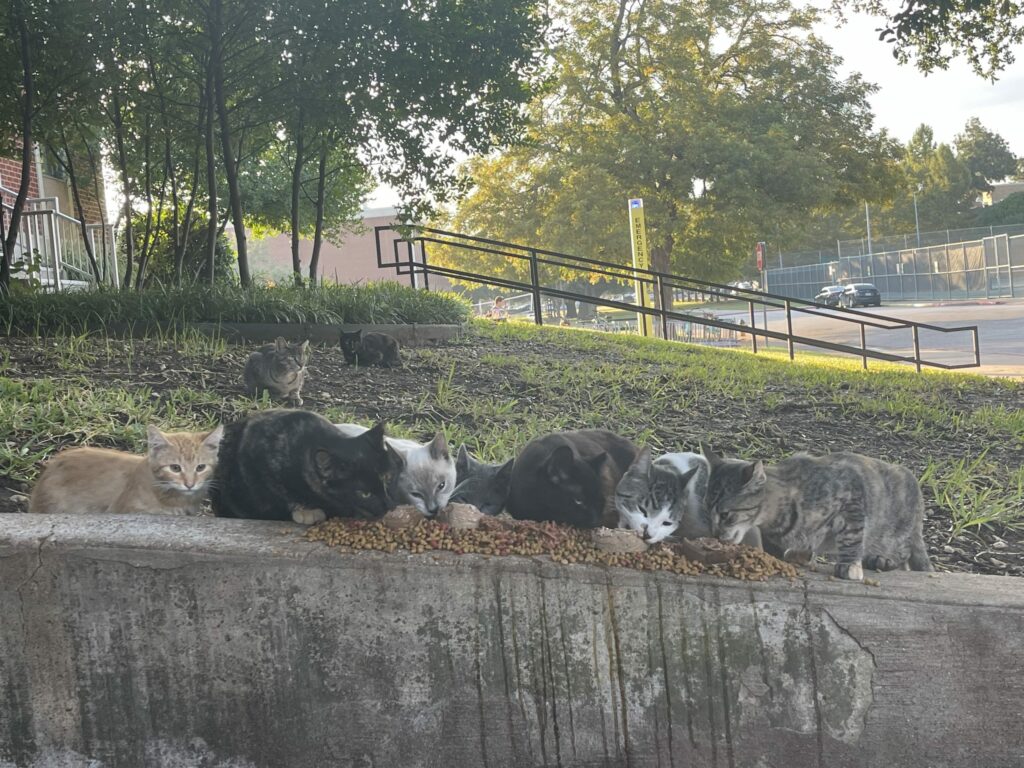
On Friday, a volunteer with Animal Birth Control of Waco arrived to feed cats at one of several colonies she regularly visits on campus. The volunteer was met with a pest control worker, who allegedly told her Baylor University had hired his company to trap and relocate all the feral cats on campus. Carrie Spivey, executive director of Animal Birth Control of Waco, says the cats in question aren’t just strays — they’re part of a managed colony program. Spivey says that relocating these cats would be both illegal and inhumane under Texas law. The cats have become an integral part of campus life, with students regularly interacting with them, taking photos, and giving them names.

While the cats are still alive and well, how long will Baylor be keeping them around? Feeding stray animals is not a crime. College aged students should know to not interact with dangerous, wild animals. Finally, I’d rather care for helpless, innocent creatures than worry about infrastructure with a budget for cleaning.


Elizabeth Riley hails from Tennessee and is a graduate of English Literature and Professional Writing & Rhetoric from Baylor University. With passions in archival preservation, communal connection, and women in sports, she writes because it matters, with hopes of bridging villages and fostering revelry amongst them.
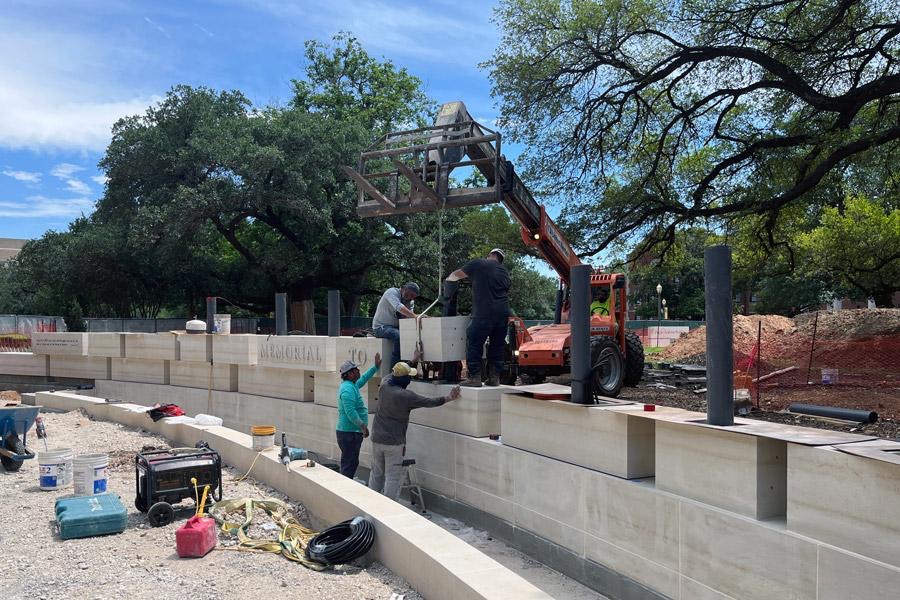
Baylor University’s campus looks a little different at the moment. There are fenced-off portions of campus undergoing obvious reconstruction, accompanied by the sights of orange cones and the shouts of crew workers. A major project at the heart of campus that is causing much of this congestion is a huge step towards Baylor’s future.

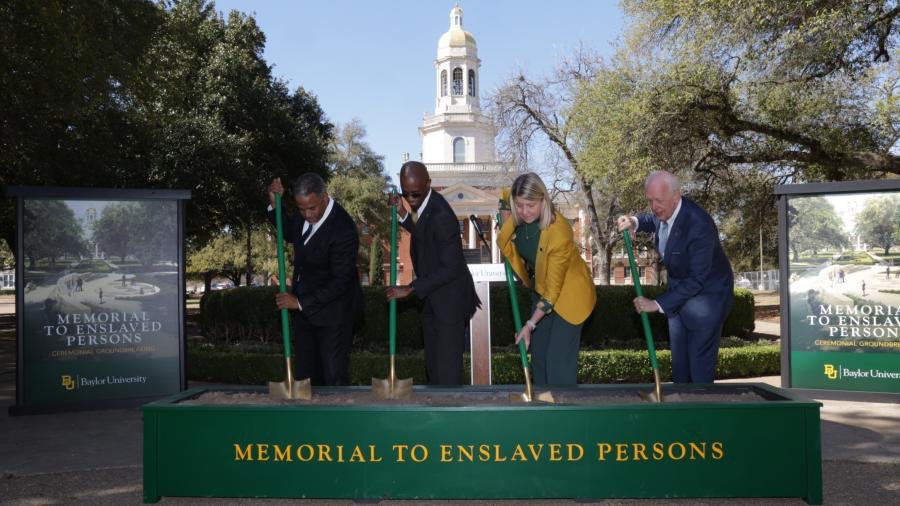
The Memorial to Enslaved Persons is restructuring Founders Mall to acknowledge the immoral use of chattel enslavement during the building of Baylor’s original campus in Independence and the activities of daily life for nearly two decades. On Baylor’s ‘Background & History for a Memorial to Enslaved Persons’ webpage, it states, “It is an acknowledgment of a challenging part of our history while helping us see the need for Christian repentance while we press toward renewal, reconciliation and restoration.” Unfortunately, this isn’t the only accountability Baylor needs to take.
Previously, Baylor University and the City of Waco attempted to reconcile with Indigenous populations that originally inhabited the area. In October of 2020, Baylor authorized research on the history of Baylor’s land and its connections to Indigenous People, and in November of 2022, the University presented a Land Acknowledgement during Native American Heritage Month. In May of 2022, the Baylor Board approved a four-phase plan to address priorities identified by the Commission on Historic Campus Representations:
Phase One is complete, with the new Campus Experience Project.
Phase Two formally began February 20, 2024, with the ceremonial groundbreaking for the Memorial to Enslaved Persons. This phase also includes additional historical context being placed around the existing Judge Baylor statue, connecting his history of enslavement with those individuals recognized by the Memorial.
Phase Three will include enhancements to Speight Avenue that explain how the land upon which Baylor sits evolved and was developed, often at the expense of communities and individuals already occupying the property.
Phase Four will feature improvements along the Quadrangle.

Elizabeth Riley hails from Tennessee and is a graduate of English Literature and Professional Writing & Rhetoric from Baylor University. With passions in archival preservation, communal connection, and women in sports, she writes because it matters, with hopes of bridging villages and fostering revelry amongst them.
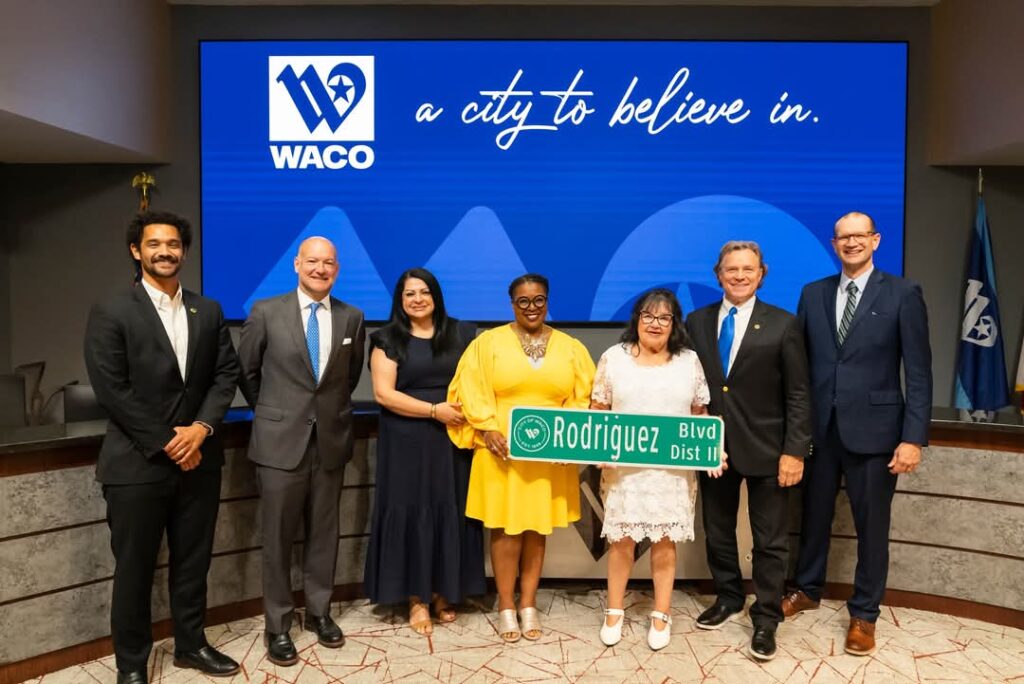
WACO, Texas — At Tuesday’s City Council meeting, Council Member Alice Rodriguez concluded more than 26 years of service as she passed leadership of District 2 to Isabel Lozano.
Rodriguez’s final meeting featured a mariachi performance and a reception in her honor, highlighting her decades of dedication to South Waco. Mayor Jim Holmes also announced the development of a new public space — Alice Martinez Rodriguez Park — to be built at the former Floyd Casey Stadium site in recognition of her lasting impact on the community.
Rodriguez’s legacy includes championing key initiatives such as the Cotton Palace ballfields, the Floyd Casey housing development and various Hispanic heritage programs.
The City of Waco extends its sincere gratitude to Rodriguez for her years of service, leadership and commitment to District 2.
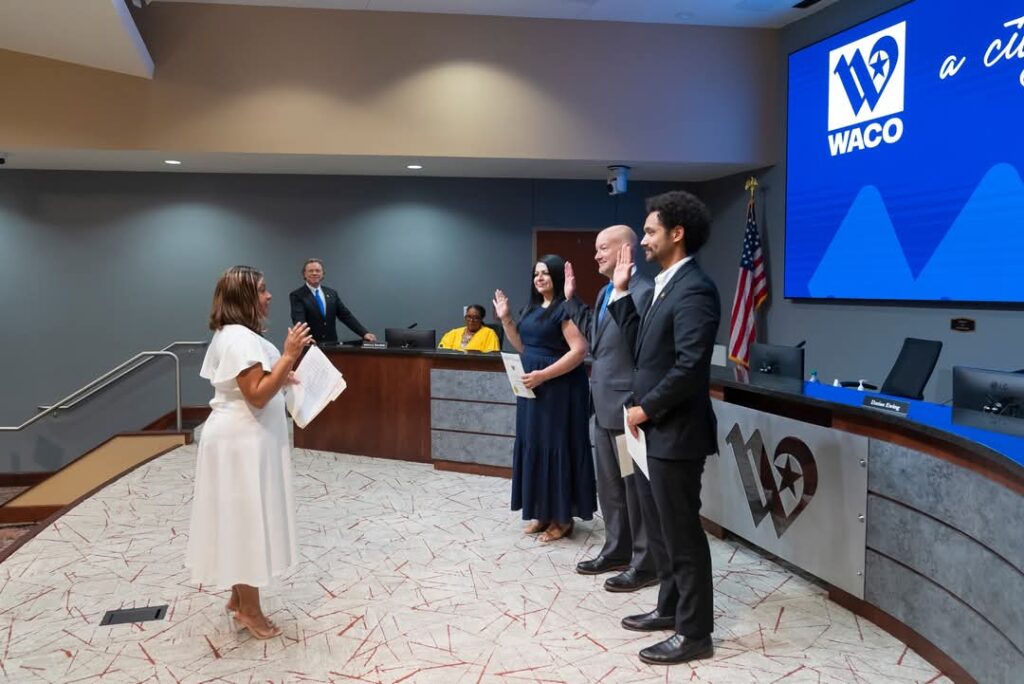
This week’s meeting also marked the swearing-in of three council members: returning members Darius Ewing (District 4) and George Chase (District 5), as well as newcomer Isabel Lozano (District 2). All will serve two-year terms.
Additionally, Council Member Andrea Barefield (District 1) was named mayor pro tem by a vote of the council. The mayor pro tem assumes mayoral duties in the absence of Mayor Holmes.
The city looks forward to continued progress under the leadership of its newly seated council.
Election season is in full swing with candidates campaigning their proposed plans for our communities. Alongside the Presidential candidates, many Texas officials will also be on the ballot at the federal, state, and local levels. To find Texas offices up for election, click here.
September 17th was National Voter Registration Day, in which democracy is fully celebrated and promoted as a nonpartisan, civic holiday. Voter registration closes October 7th, with early voting starting as early as October 21st.
To register to vote, request a postage-paid application through the mail or find one at the county voter registrars’ office, some post offices, government offices, or high schools. You can also print out the online application and mail it to the voter registrar. Applications must be postmarked by October 7. The McLennan County Elections Administration Office (Records Building Basement) is located at 214 North Fourth Street Suite 300, Waco, TX 76701.
When you register to vote, it is typically maintained for life. For this election season, Texan voters should check voter registration status since Governor Greg Abbott’s voter roll clean-up that deemed more than one million voters ineligible, most who have moved or passed away.
McLennan County will have multiple polling centers across the region, with only particular sites available for early voting. To find the nearest voting center, view the website here. For all other voting concerns, please visit www.mclennan.gov. Election day is on November 5th, with polls open from 7 a.m. to 7 p.m. Exercise your right to vote this November!
Elizabeth Riley hails from Tennessee and is a senior double majoring in English and Professional Writing & Rhetoric at Baylor University. She works as a Transcription Assistant at the Baylor University Institute for Oral History and is the President of the Baylor Ice Girls for the 2024–2025 season.
by: Debrah Wright
As Waco prepares for its municipal elections, attention turns to the candidates and the diverse issues they aim to tackle. The mayoral race, in particular, has garnered interest, with candidates offering varied approaches to address the city’s challenges and opportunities.
**Mark Your Calendars: Election Details**
The general election for the City of Waco Mayor and Council Members for Districts I and III is scheduled for Saturday, May 4, 2024. Early voting will be open from April 22 through April 30, 2024, providing flexibility for residents to participate. Following the election, those elected will be sworn in at a Special Meeting on May 14, 2024, at 6 p.m.
**Accessible Voting Locations and Times:**
McLennan County has designated multiple early voting sites, including the Records Building, community centers, and libraries, ensuring accessibility for all residents. The early voting schedule offers extended hours, accommodating diverse schedules and commitments. Below are the early voting locations and times:
– McLennan County Records Building: 214 N 4th Street, Suite 300
– Robinson Community Center: 106 W. Lyndale Avenue
– Waco Multi-Purpose Community Center: 1020 Elm Avenue
– West Waco Library: 5301 Bosque Blvd
– Hewitt City Hall: 200 Patriot Court
Early voting times are as follows:
– Monday, April 22 to Friday, April 26: 8 a.m. to 5 p.m. each day
– Saturday, April 27: 7 a.m. to 7 p.m.
– Sunday, April 28: 1 to 6 p.m.
– Monday, April 29 to Tuesday, April 30: 7 a.m. to 7 p.m. each day
The mayoral race features three candidates:
Three candidates are vying to become the next mayor of Waco, to be decided in May. Jim Holmes, the District 5 council member and mayor pro tem; Aubrey Robertson, an attorney and former Democratic candidate for McLennan County district attorney; and Eric Brown, a pastor and activist, have each filed for the seat. The winner of the May 4 election will succeed Dillon Meek.
**Jim Holmes:** Jim Holmes has served on the Waco City Council since 2016. With 35 years of financial management experience, including roles as COO/EVP of FirstCity Financial Corp & SVP of FNB of Central Texas, he brings a wealth of expertise. Currently, he serves as President of HOTCOG, Chairman of Waco MPO, & Board Director for Waco Sports Commission & Cameron Park Zoo. Jim is a graduate of Creighton University and attended Baylor School of Law. Bringing a background in public service, Holmes emphasizes infrastructure investment and economic development as key priorities for Waco’s future. (https://www.jimholmeswaco.org/)
**Aubrey Robertson:** Aubrey Robertson is an attorney with a background in Political Science and Slavic and Eastern European Studies. Transitioning from aspiring to draft constitutions for former Soviet countries to focusing on the criminal justice system, he gained experience in mock trials and criminal law clinics. Aubrey’s extensive experience includes pro bono work, internships, and roles as both a prosecutor and defense attorney. Currently serving as the District Court Felony Chief at the Law Offices of Vic Feazell, P.C., he prioritizes keeping clients informed and confident throughout legal proceedings. With a focus on economic revitalization and community empowerment, Robertson aims to foster small business growth and expand access to affordable housing, known for his stance on Public safety. (https://www.aubreyforda.com/)
**Eric Brown:** Eric Brown brings a dedication to public service and community advocacy. With a background in business administration, he focuses on economic development, education, affordable housing, public safety, environmental sustainability, and social equity. Eric aims to create a brighter future for all residents through innovative solutions and active listening to community voices. Advocating for grassroots initiatives and sustainable development, Brown prioritizes environmental stewardship, social equity, and inclusive governance. (https://www.ericforwaco.com/)
In addition to the mayoral race, other important contests include:
– Waco Independent School District Board of Trustees At-Large, Place 6: Keith Guillory and Lauren Caldwell offer their visions for the future of education in Waco.
– McLennan Central Appraisal District Board Member, Place 2: David R. Schleicher and Perry Felton vie for this position, focusing on fair property assessments.
– McLennan Central Appraisal District Board Member, Place 3: William “Bill” W. Vernon, Jr., Linda Hatchel, and Dennis DeGraff compete for this seat, each with their own ideas for effective property valuation practices.
**Get Involved: Exercise Your Right to Vote**
As the election approaches, it’s crucial for Waco residents to educate themselves on the candidates and their platforms. Whether casting their ballots during early voting or on Election Day, every vote counts in shaping the future of the city. For more information on voting locations and ballots, residents can visit mclennan.gov/elections and make their voices heard in this pivotal election.

(City council, school board, planning commission, county commissioners – these groups and several others represent us. They do the day to day work of running our community. It is our responsibility to keep informed about their work so that we can help them represent us effectively. “Civic Insights” by Jeffrey Vitarius is a regular feature of Act Locally Waco. Its purpose is to help us understand decisions that shape our community so that we can participate effectively as informed, engaged residents of Waco. – ALW)
By Jeffrey Vitarius
We hope you all had a safe and enjoyable Thanksgiving and thought it might be good to start back up with a topic we find particularly interesting, bus rapid transit (BRT).
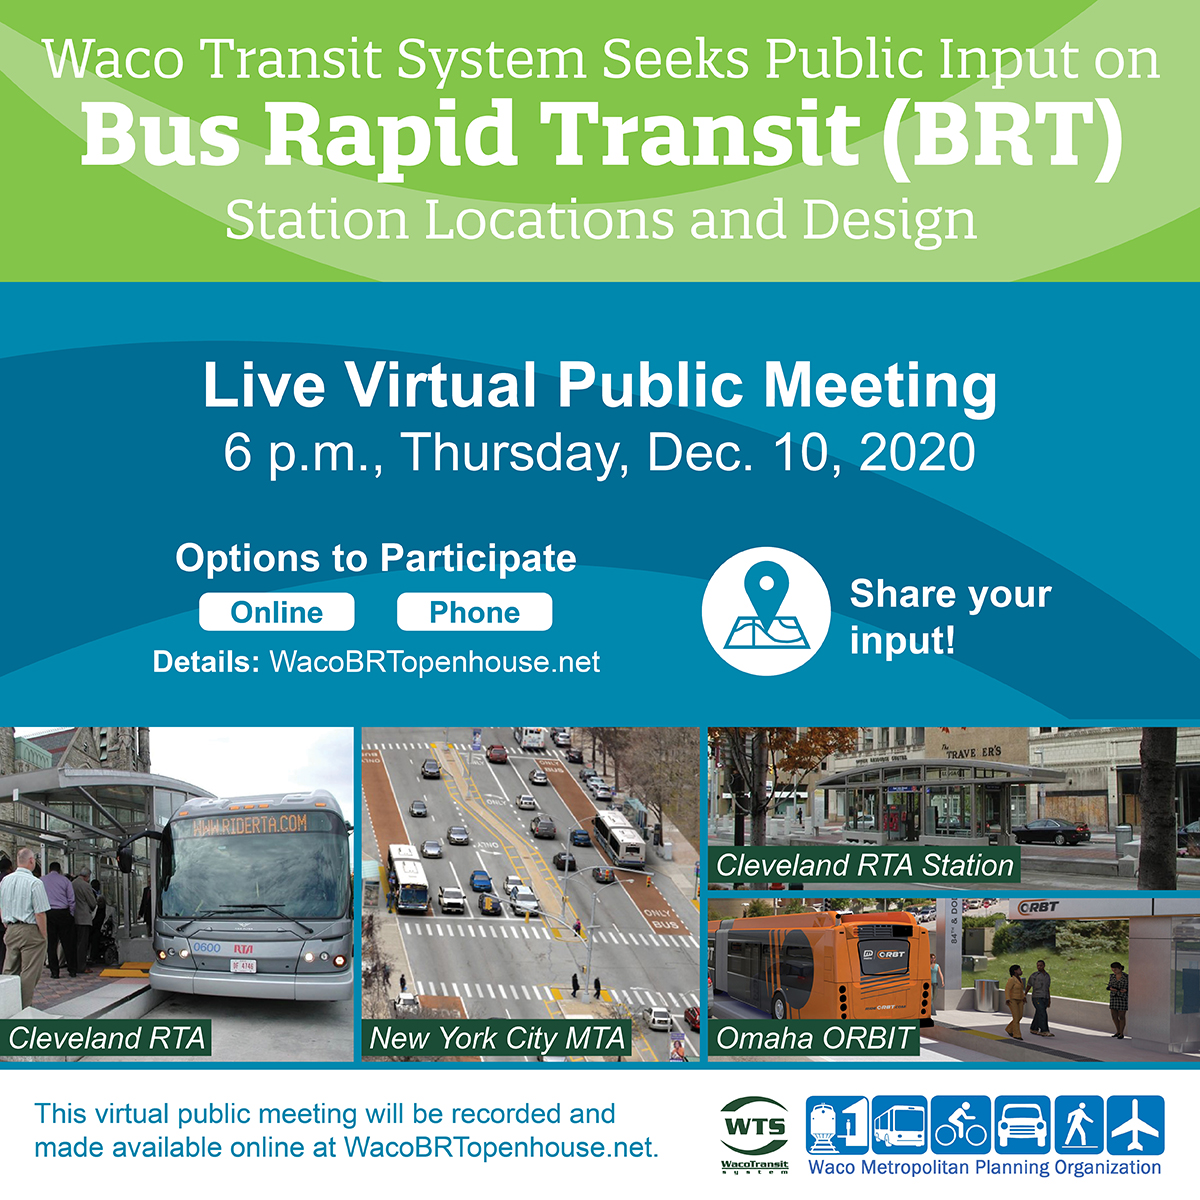
Next Thursday (December 10th, 2020) at 6:00 pm Waco Transit, the Waco Metropolitan Planning Organization (MPO), and AECOM Technical Services are hosting a virtual meeting to gather public input on station locations and designs for the BRT project. AECOM also recently provided updates to the City Council and MPO on the progress of the project. Let’s take a look at why this project is being considered and what stage of the process we are in now.
Way back in 2013-4, the City of Waco commissioned an Economic Development Strategic Plan from the W.E. Upjohn Institute for Employment Research. The study is generally called the Upjohn Report. Unlike a standard economic development strategy that focuses purely on the “general economic performance of the area,” the City “called for a plan to also reduce poverty, increase labor force participation, and increase area income.” That is, rather than focus on economic growth in and of itself, the plan also focused on how that growth might be made equitable for the people of Waco. This focus on equitable development rather than just any development remains an important goal of the City.
In the process of drafting their report, the Upjohn team interviewed ninety individuals, asking them (in part) about what challenges they see to finding and retaining employment. The result, “transportation was overwhelmingly cited as the most prominent barrier to finding and keeping a job.” In 2018, about 8% of Wacoans got to work by a means other than a car. At that time approximately 29% of Wacoan households had no car or 1 car. The average household size in Waco is about 2.5 people meaning that having one car could mean a household is still reliant on a non-car means of getting to work.
Although walking or cycling remain valuable commuting options for folks (your author does so whenever he can), needing to rely on your feet or your bike makes you vulnerable to long distances and poor weather (especially August heat). Given these challenges, it is critical for those in Waco who do not have ready access to a car that public transit gets people where they need to go reliably and as swiftly as possible.
The current Waco transit system is configured as a “spoke and hub.” In this design bus routes extend out from the City core to residential neighborhoods, job centers, and service locations before returning Downtown. The routes out and back are the “spokes” with the Downtown Transit Center as the “hub.” The transit map below shows how the various routes converge at the transit center downtown before spanning out across the city.
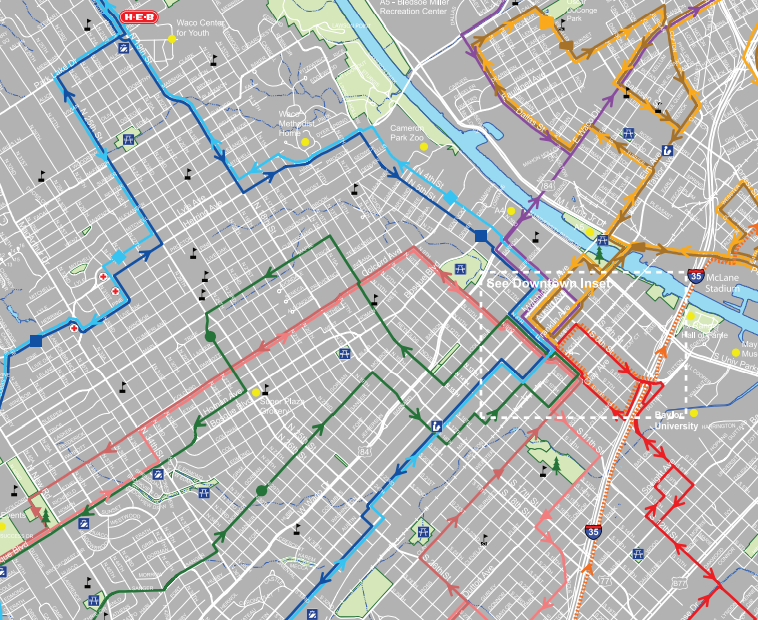
(Map 1)
This configuration has its challenges. The spoke and hub setup means that to get from one side of town to the other, an individual has to transfer at the “hub,” lengthening travel times. Additionally, the variety of routes mean that each route can only be run once an hour (in the case of East Waco the route runs varying directions based on what hour of the day it is).
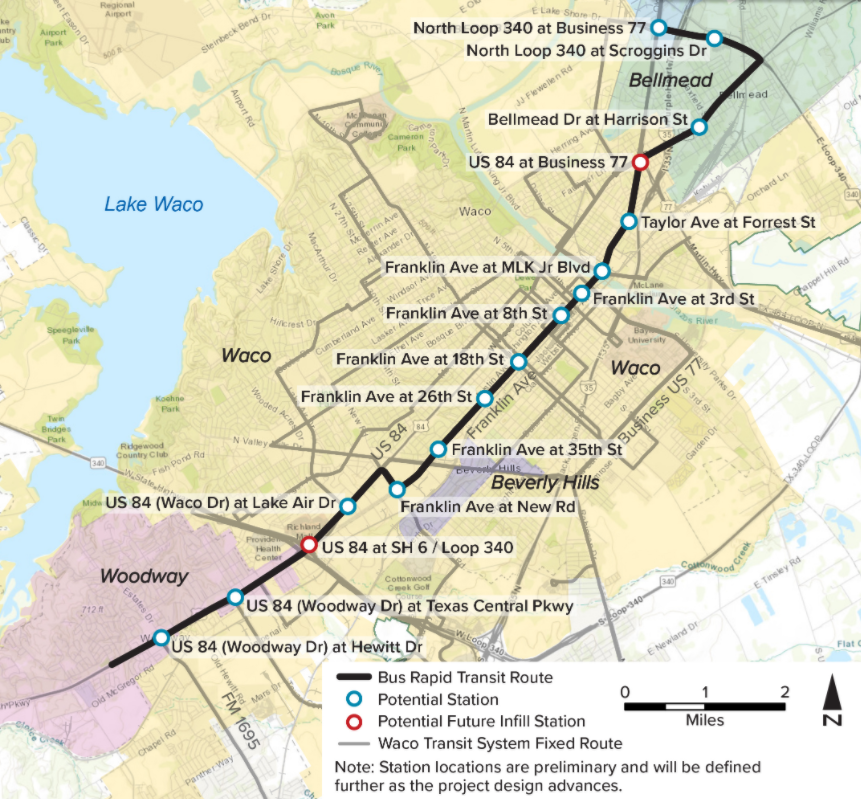
BRT may be the solution to these issues. The BRT would run through the middle of the city extending from Woodway through Downtown Waco and on to Belmead and Lacy Lakeview. The BRT would make fewer stops and be timed to traffic. This would, theoretically, reduce the delays caused by passengers entering and exiting the bus as well as the delays caused by sitting in traffic. The goal of such a system would be to maximize the time the bus is in motion, therefore reducing travel times. It is also hoped that such a system would generate more frequent bus service and bus services that extend more into weekends and evenings (an important factor when considering whether folks can get to work when they need to).
In 2018, the City received a feasibility study from AECOM Technical Services that looked at the potential system overall as well as a number of route, technology, and service operation options. The study recommended (after substantial public input) a route that ran from US 84 to New Road to Franklin Avenue to Taylor Street and Hillsboro Drive before taking US 84 to Loop 340. On May 1, 2018 the City Council approved the recommended route. Below is the most recent map of the proposed route.
Since then, the City, the MPO, and AECOM have begun the process of seeking federal funding for the project. In July of 2019, pre-award authority was granted that allows the City to begin pursuing projected development costs before receiving a formal award. Under this authorization the City sought services for preliminary engineering and environmental review. We are in the middle of that process now.
Preliminary engineering (think of this as preliminary technical design) needs to be completed to understand the final costs of the project and pursue the funding needed to cover those costs. Environmental review is required to make sure the project will not unduly damage Waco’s environment. Throughout this part of the process there are three different periods of public input planned. The first passed in October, when AECOM sought to reintroduce the project to Wacoans and update them on the project approach. The second is the meeting coming up on December 10. This one will focus on where stations will be and how they will function. Both of these aspects can have a huge impact on cost and operations down the line. Finally, in mid-February it is anticipated that the final results for this phase of the project will be brought before the public for review.
Other Interesting Items from the Agenda (to me)
- Over the last two meetings City Council has received information regarding a Municipal Settings Designation (MSD). In short, this would reduce a hurdle to development in the city’s core by prohibiting the future use of groundwater as potable (safe to drink). Without a Municipal Settings Designation each property owner would have to deal with testing and remediating groundwater contamination before development which can slow projects in an area where the city provides water to all properties anyhow.
- The City and WISD are working on a partnership to provide all WISD students with e-cards that would grant them access to the library’s substantial e-book catalogue.
- The J.H. Hines Elementary Sidewalks project continues with the city pursuing $101,918.37 in property acquisitions to account for right of way needs.
Meeting Basics
- City Council meets on the first and third Tuesday of every month. Work session – 3:00 pm / Business session – 6:00pm (there have been two meetings since our last post)
- To watch the recorded session click here (City of Waco Cable Channel, wccc.tv)
- For the full agenda click here (11/17) or here (12/01)
- For the meeting packet with the documents pertinent to the meeting click here (11/17) or here (12/01)

Jeffrey Vitarius has been actively local since early 2017. He lives in Sanger Heights with partner (JD) and his son (Callahan). He helped found Waco Pride Network and spearheaded its Vision 2025 process. Jeffrey works at City Center Waco where he helps keep Downtown Waco clean, safe, and vibrant. He is a member of St. Alban’s Episcopal Church and graduated from Baylor in 2011.
The Act Locally Waco blog publishes posts with a connection to these aspirations for Waco. If you are interested in writing for the Act Locally Waco Blog, please email [email protected]for more information.
(City council, school board, planning commission, county commissioners – these groups and several others represent us. They do the day to day work of running our community. It is our responsibility to keep informed about their work so that we can help them represent us effectively. “Civic Insights” by Jeffrey Vitarius is a regular feature of Act Locally Waco. Its purpose is to help us understand decisions that shape our community so that we can participate effectively as informed, engaged residents of Waco. – ALW)

By Jeffrey Vitarius
On Tuesday November 10, 2020, the Budget & Audit committee of the City Council met. Their only discussion item was a review of the proposed Capital Improvements Program (CIP) and the associated debt impacts. Let’s breakdown what all this means and how it relates to the street in front of your house.
What is the Budget & Audit committee of the City Council?
This is the group of City Council members charged with taking a closer look at the city’s budget and audit functions.
So, is the Capital Improvements Program (CIP) a kind of budget?
Well, it is similar to one. Broadly speaking the city “budget” can be thought of as broken down into two parts, the operating budget and the CIP. The operating budget covers the services the city provides as well as its day-to-day work (we touched on an interesting summary of these services last week).The CIP covers large-scale projects. As this year’s budget explains “The CIP includes those items typically thought of as ‘infrastructure’ – streets, water and wastewater lines” (hmmm…streets, water, and wastewater sound familiar).
Since the CIP involves projects that span over multiple years, involve large dollar amounts, and often have a variety of funding sources (including debt) they are dealt with through a process separate from the operating budget.
Why is the CIP being dealt with now? Wasn’t the budget process in September?
In previous years, the CIP was developed at the same time as the operating budget (prior to September). This year, however, there was a change. The CIP process was moved to the winter after the budget process was concluded.
There were a number of reasons for the change, but two stand out. First, moving the CIP to its own time of the year allows staff and the City Council to focus on it alone in the winter rather than trying to split focus between developing the CIP and the operating budget. Second, moving the CIP to winter means that staff can work with certified property values.
As you may remember back when the Operating budget was adopted, the McLennan County Appraisal District was only able to issue a certified estimate of property values in Waco. At the time almost $1.8 billion dollars of value was still being protested (meaning it was still unclear exactly what those properties would be valued at and how much property tax revenue they would generate). The potential changes from the protest process make it difficult to build any kind of budget, but they are particularly problematic when you have to project a budget out for the multiple years required for CIP development.
So what does the CIP tell us?
In the broadest sense the CIP is a list of all the “infrastructure” projects the city plans to tackle during the year along with how it plans to pay for them.
What has happened so far in the process?
Back at its September 8th meeting the Budget and Audit Committee discussed the timeline change noted above. In October they held a preliminary discussion with staff regarding priorities. This week they reviewed the CIP drafted by staff in response to the discussion in October.
What is in this year’s proposed CIP?
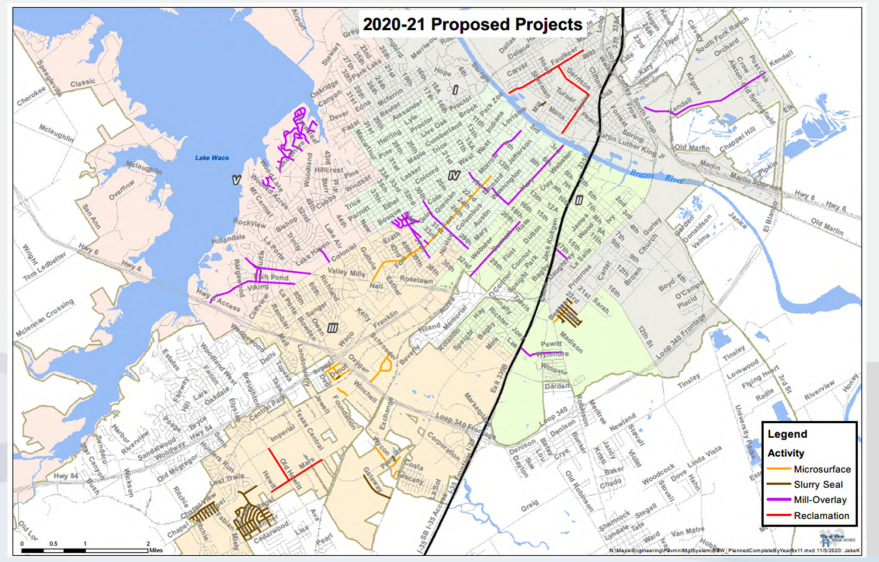
Details of the proposed CIP can be found in the meeting packet for this week’s Budget and Audit Committee meeting. From a high level this CIP proposes $112,879,149 of capital spending in fiscal year 2021. $31,635,519 is planned for streets (see map below), $1,050,000 for park development, $6,150,000 for solid waste, $7,595,000 for airport improvements (mostly funded by CARES act funding), and finally $66,448,630 for utilities (water and wastewater).
The other critical part of the CIP is how all these projects are to be funded. A substantial part of the costs listed above are planned to be covered by the issuance of new debt (approximately 71%). The City staff is aiming to issue this debt in early 2021 (how the City issues debt is an interesting topic for a different time).
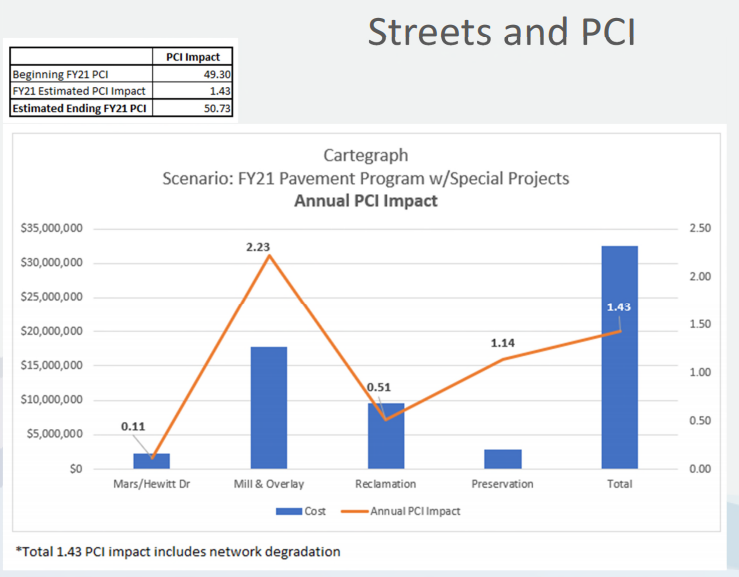
One last interesting take away from the proposed CIP is the chart below. It references a measure called PCI. This stands for pavement condition index. In short this is a metric for measuring the quality of streets. It runs from 0 to 100. This chart compares spending on various kinds of roadwork to their PCI impact. Overall, the anticipated PCI change is 1.43 (including the natural decay of the existing inventory). This would move Waco from 49.3 to 50.73 (an improvement of 3%).
What comes next?
- December 15th – City Council plans to approve resolution related to the issuance of debt for capital projects
- February 2nd – City Council plans to approve final CIP
Meeting Basics
- Budget & Audit Committee Regular meeting – Tuesday, November 10, 2020, 1:30 pm
- To watch the recorded session click here (City of Waco Cable Channel on YouTube)
- For the full agenda click here
- For the meeting packet with the documents pertinent to the meeting click here.
Jeffrey Vitarius has been actively local since early 2017. He lives in Sanger Heights with partner (JD) and his son (Callahan). He helped found Waco Pride Network and spearheaded its Vision 2025 process. Jeffrey works at City Center Waco where he helps keep Downtown Waco clean, safe, and vibrant. He is a member of St. Alban’s Episcopal Church and graduated from Baylor in 2011.
The Act Locally Waco blog publishes posts with a connection to these aspirations for Waco. If you are interested in writing for the Act Locally Waco Blog, please email [email protected]for more information.
(City council, school board, planning commission, county commissioners – these groups and several others represent us. They do the day to day work of running our community. It is our responsibility to keep informed about their work so that we can help them represent us effectively. “Civic Insights” by Jeffrey Vitarius is a regular feature of Act Locally Waco. Its purpose is to help us understand decisions that shape our community so that we can participate effectively as informed, engaged residents of Waco. – ALW)

By Jeffrey Vitarius
This week we are going to try to unpack the following item from the November 3, 2020 City Council Agenda: “Consider a resolution approving an agreement with WBW Single Development Group, LLC – Series 110 for an Annexation Service Plan for certain properties described as 61.51 acres of land, more or less, situated in and being out of the B.B.B. & C. Railroad Company Survey, Abstract No. 157, McLennan County, Texas, and being a part of the called 194.45 acre tract of land described in a Deed to WBW Single Land Investment, LLC – Series 104, recorded in Document No. 2019028303 of the Official Public Records of McLennan County, Texas, and being located near the intersection of Warren Road and Ritchie Road and further located within Waco’s extraterritorial jurisdiction, which said territory lies adjacent to and adjoins the present boundary limits of the City of Waco, Texas”.
Whew! This is a long one, let’s jump right in.
What kind of agreement is the City approving with WBW SIngle Development Group, LLC – Series 110?
On July 29th, 2020 WBW Single Development Group, LLC – Series 110 (lets just call them WBW for now) requested that the City annex certain property they own. Annexation is the process by which a city adds bits of land to its jurisdiction and begins to collect taxes from and provide services to those areas. There are a number of different ways annexation can occur. This week there are three instances of property owners requesting annexation on the City Council agenda. This process of a property owner requesting annexation from a city is managed by the Local Government Code (in particular Chapter 43 deals with annexations and subchapter C-3 deals with this specific kind of annexation).
The code requires that the property owner and city come to a written agreement regarding services, an “Annexation Service Plan.” Approving this agreement is the specific action City Council took this week.
What is an “Annexation Service Plan”?
Chapter 43 makes this one fairly simple. An Annexation Service Plan needs to list the services the municipality will provide and identify when it will provide them. The Annexation Service Plan for this item can be found in this week’s meeting packet (packet pages 124-7). The plan is actually a pretty interesting way to look at the bare bones of what the city does. Here is a list of the services the plan identifies:
- Police Protection
- Fire Protection and Emergency Medical Services
- Solid Waste Collection
- Water Service
- Waste Water Service
- Capital Improvements (building infrastructure for the most part)
- Street Lights
- Traffic Control (things like traffic signs, and stop lights)
- Maintenance of Existing Roads & Streets
- Environmental Services
- Maintenance of Parks & Recreation Facilities
- Maintenance of Publicly Owned Facility, Building or Municipal Service
- Provision of Other City Services (libraries, animal control, code enforcement, etc)
- Election Voting Services
This is almost a social contract in its most basic form. A property owner is agreeing to join the city and take on both the responsibility of paying its property taxes and abiding by its ordinances and the services the city agrees to provide. Additionally, this list makes clear just how often the citizens of Waco are impacted by the city. Driving to work involves city maintained roads and traffic signals. Watering lawns involve city water delivered through city pipes.
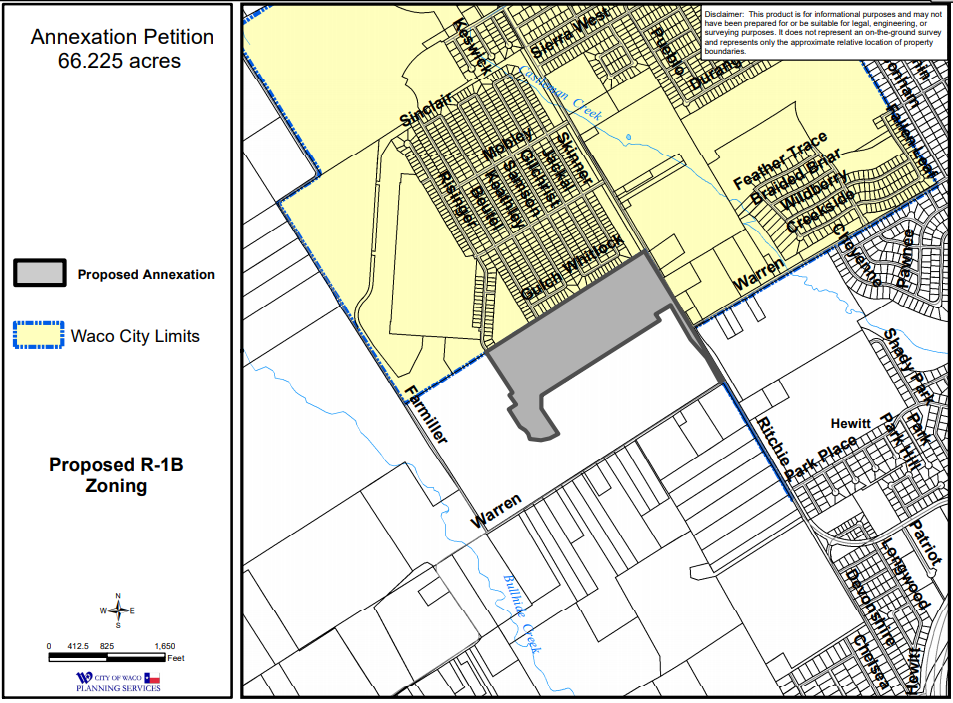
What does all that after “more or less, situated in” mean?
This section of the item lays out where the land being considered is located. The meeting packet includes a map as well (included below) on packet page 123, but this language is a general legal description of where the land is located. The item also includes a survey (on packet pages 130-1) that lays out even more detail regarding the exact parameters of the land being considered.
Why does the item mention Waco’s extraterritorial jurisdiction (ETJ)?
One of the requirements for annexation is that the land lay in the ETJ.
So, let’s go back to the initial sentence. We can now summarize it to mean: consider approving an agreement with a property owner to begin providing city services to a property described as x that is within Waco’s ETJ.
What comes next?
- November 17th – Public Hearing and First Reading/Vote
- December 1st – Second Reading/Vote
Other Interesting Items From the Agenda (to me)
- Impact fees are back for their second reading. There is also a work session item regarding how they could be changed in the future. This was one of the bigger questions Council member Holmes had two weeks ago.
- There are three Annexation Service Plans up for consideration. All in all they represent about 290 acres. The second and third of these plans are with the Waco Industrial Foundation which is an interesting topic for a different time.
- There are two resolutions and one ordinance related to Boards and Commissions. The resolutions are general and deal with approving appointments and clarifying certain language around advisory boards. The ordinance deals specifically with the Sustainable Resource Practices Advisory Board adjusting its mission, purpose, and membership.
Meeting Basics
- City Council meets on the first and third Tuesdays of every month.Work Session – 3:00 pm / Business Session – 6:00pm
- To watch the recorded session click here (City of Waco Cable Channel, wccc.tv)
- For the full agenda click here
- For the meeting packet with the documents pertinent to the meeting click here.

Jeffrey Vitarius has been actively local since early 2017. He lives in Sanger Heights with partner (JD) and his son (Callahan). He helped found Waco Pride Network and now serves as that organization’s treasurer and Pride Planning Chair. Jeffrey works at City Center Waco where he helps keep Downtown Waco clean, safe, and vibrant. He is a member of St. Alban’s Episcopal Church and graduated from Baylor in 2011.
The Act Locally Waco blog publishes posts with a connection to these aspirations for Waco. If you are interested in writing for the Act Locally Waco Blog, please email [email protected]for more information.