
County census data #4: Housing & households
By Jeremy Rhodes
The first wave of data releases from the 2020 US Census is here, and many of the demographic shifts that we’ve seen across the country and the state are mirrored in our Waco community. In this series of posts, I am presenting some of the demographic changes we see in McLennan County from 2010 to 2020.
The first post presented numbers regarding general population growth and decline. The second post showed an overview of racial and ethnic changes in the county. The third post expanded on the racial/ethnic changes in McLennan County since 2010. In this post, we will look at some of the changes to the housing landscape in Waco since 2010.
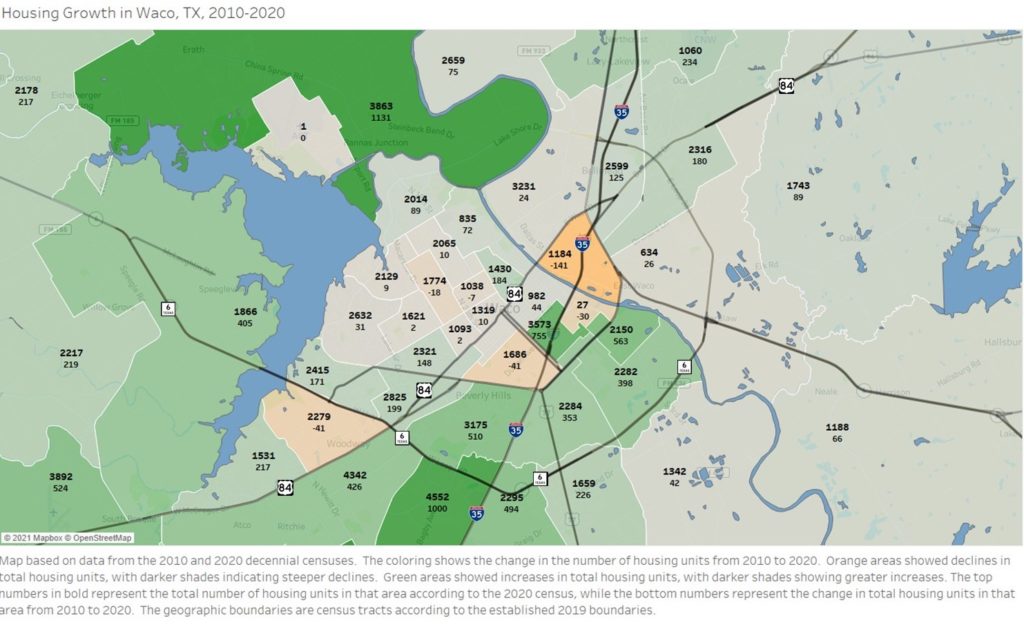
This first map shows the number of housing units in each area, as well as the change in housing units since 2010. The orange areas saw a decline in total housing units, with darker shades indicating a larger decline. The green areas saw an increase in total housing units, with darker shades indicating a larger increase. The top number shows the total number of housing units in that area, while the bottom number shows the change in number of housing units since 2010.
Most of central Waco and north Waco saw little change in total number of housing units from 2010 to 2020. The largest growth in housing units was seen in China Spring, with an addition of 1131 housing units, and Hewitt, with an addition of 1,000 units. Only six census tracts saw declines in the number of housing units since 2010. One of the historic East Waco tracts (tract 15) saw the largest decline in housing units, with a loss of 141 households. Most of the county saw moderate to robust housing growth.
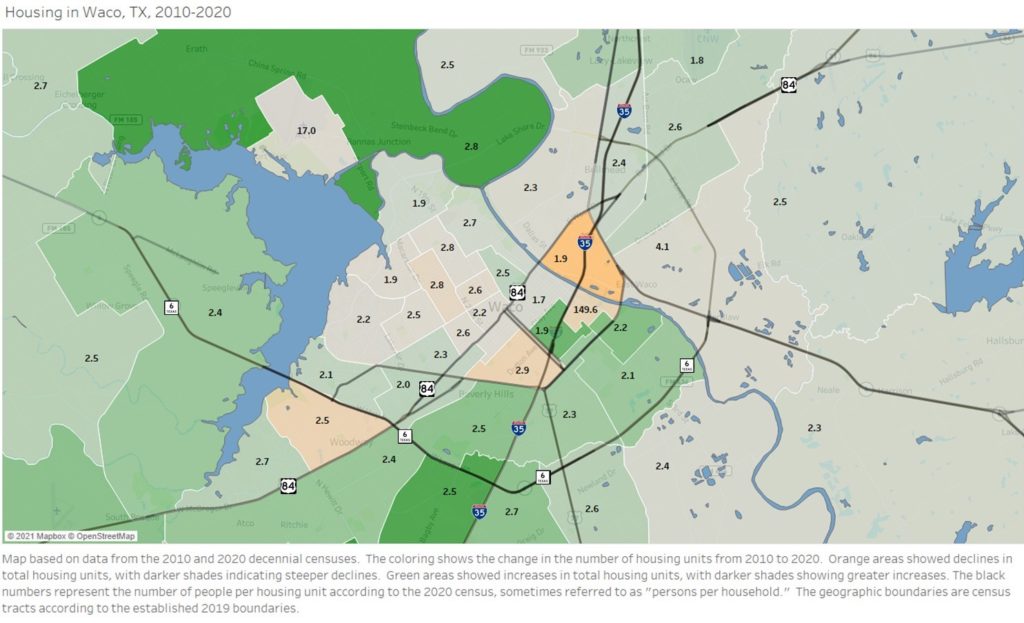
The second map is similar to the first. The coloring is the same, with green shades indicating growth in housing units since 2010, and orange shades indicating decline in housing units since 2010. The black number in each tract is different in this map; it displays the number of residents per household in that area. Most of the county has between two and three people per household. Notable exceptions include downtown Waco and historic East Waco, where there are fewer than two residents per housing unit.
There are two outlier tracts that should be explained. In the northwest of the map, you will see a tract with 17 people per household. That tract is the airport, and we should not think too much about housing and population data for that tract. The other outlier is the tract containing Baylor University, which has a “persons per household” of 149.6. Although the Census Bureau does not consider dorms to be housing units, I cannot be certain how they obtained such a high number while excluding dorms from consideration.
If you have any questions about this, or if you would like Jeremy to give an overview of these changes to your group, staff, or organization through Zoom or in person, please contact Jeremy Rhodes at [email protected].
Jeremy Rhodes, Ph.D., is director of research and community impact for Prosper Waco.
The Act Locally Waco blog publishes posts with a connection to these aspirations for Waco. If you are interested in writing for the Act Locally Waco Blog, please email Ferrell Foster at [email protected].