
For many, the turn of the calendar marks new beginnings, and the Greater Waco area, in agreement, has stepped into another year of development. Alongside the construction and traffic of infrastructure improvements, budding business adventures are opening their doors to new possibilities in Waco.
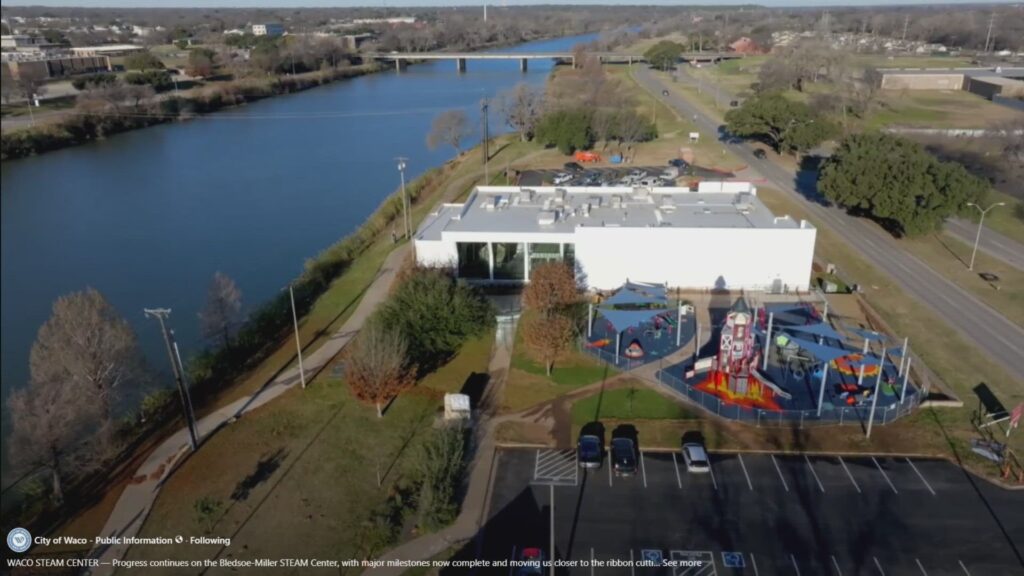
Recently, the Bledsoe-Miller STEAM Center celebrated its launch directly on the banks of the Brazos. The Bledsoe-Miller STEAM Center provides a thriving environment for science, technology, engineering, art, and mathematics, where Wacoans of any age can learn, play, and work in a space dedicated to their creative and educational advancements. With teaching kitchens, robotic laboratories, recording studios, and standard playgrounds, there is no dream too big to create at the Bledsoe-Miller STEAM Center.

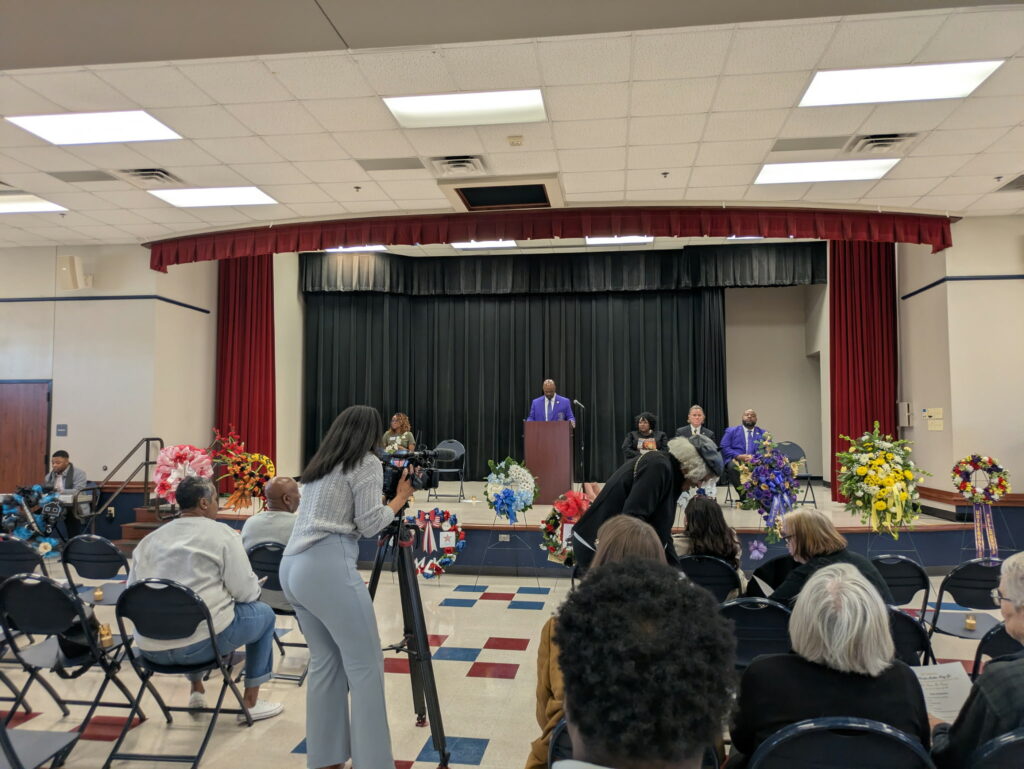
Dreaming big has never been a bad thing, and as we approach Black History Month, we take a necessary moment to celebrate one of the most influential dreamers in American History, Reverend Dr. Martin Luther King Jr., who is nationally honored on the third Monday of January each year. Here in Waco, the Community Race Relations Coalition annually hosts a Wreath Laying Ceremony to commemorate the work of Dr. King and all other Civil Rights leaders. While honoring the contributions and legacies of Rev. Dr. King, this event includes various activities aimed at reflecting on Dr. King’s vision of equality, justice, and peace. Community leaders, activists, and speakers often share their thoughts on Dr. King’s impact and the ongoing struggle for civil rights, while encouraging participants to engage in service projects that embody Dr. King’s belief in serving others.
To help protect your vehicle, the U.S. Department of Transportation’s National Highway Traffic Safety Administration (NHTSA) is teaming up with the National Insurance Crime Bureau to provide information about vehicle security. Review these statistics on vehicle theft in the United States and NHTSA’s tips on keeping your vehicle safe.

Vehicle Theft Facts and Figures
· More than 1,000,000 motor vehicles were stolen in 2022, with more than 250,000 reported to law enforcement during the fourth quarter alone. This is a 25% increase in vehicle theft totals over the past few years.
· Historically, passenger cars made up approximately 74% of all stolen motor vehicles.
· A motor vehicle is stolen every 32 seconds in the United States.
· In 2022, thieves stole more than $8 billion in motor vehicle value.
How to Prevent Motor Vehicle Theft
· Park in well-lit areas.
· Close and lock all windows and doors when you park.
· Hide valuables out of sight, such as in the glove box or trunk.
· Do not leave your keys in your vehicle.
· Do not leave the area while your vehicle is running.
· Some vehicles come equipped with an alarm and anti-theft system, but what if yours does not? Consider purchasing extra layers of protection for your vehicle if your manufacturer does not provide it. This could be something like an anti-theft system, which can be easily purchased online or in a store.
Education Service Center Region 12 staff, educators, mental health advocates and care providers will join forces for the 18th Annual Teen Suicide Prevention Symposium from 9 a.m. to 4 p.m., Thursday, June 15 at 2101 W. Loop 340 in Waco.
ESC Region 12 and Partners Cedar Crest Residential Treatment Center and Daybreak Health want to gather educators, mental health providers and community members to learn and take action to help save the lives of challenged youth. The event will encourage awareness, intervention and prevention of teen suicide, regarded as the ‘preventable epidemic’ among Texas youth.
“This year’s event focuses on issues and trends impacting youth in many ways that educators, parents and care providers are seeing in our schools. From speakers on Pediatric Acute Onset Neuropsychiatric Syndrome (or PANS), to discussions about the US Surgeon General’s Advisory on Social Media and its Effect on Youth Mental Health, we are presenting cutting-edge topics that have a direct impact on our teens and their mental health,” said Jenipher Janek, a counseling services coordinator and lead for the Region 12 School Crisis Response Team.
The ESC Region 12 School Crisis Response Team includes ESC counselors and communication staff, school counselors and mental health advisors from the Heart of Texas Behavioral Health Network. The group coordinates grief response and provides logistical and communications support, and crisis recovery at no cost to area schools. In the last year, the team has responded to 18 calls to support educators and students affected by the loss of a student, employee or other crisis incident impacting school operations, including loss of life to suicide. Part of this work includes connecting schools to mental health providers and creating awareness about TCHATT, the Texas Child Health Access Through Telemedicine, which provides telemedicine or telehealth programs to school districts to help identify and assess the behavioral health needs of students and provide access to mental health services.
Event partners, expecting 80 attendees, hope to bring in even more educators, mental health providers, police officers, counselors and emergency services personnel. Advance registration ($45) is requested at: txr12.escworks.net/catalog/session.aspx?session_id=297715. Schools in the Counseling Services Membership may send staff at no additional fee. For more on ESC Region 12 Counseling Services and School Support, visit bit.ly/2023ESC12.
Additional event supporters include the Central Texas Regional Advisory Council, Heart of Texas Behavioral Health Network, Heart of Texas Regional Advisory Council, Heart of Texas Suicide Prevention Coalition and VOICE.

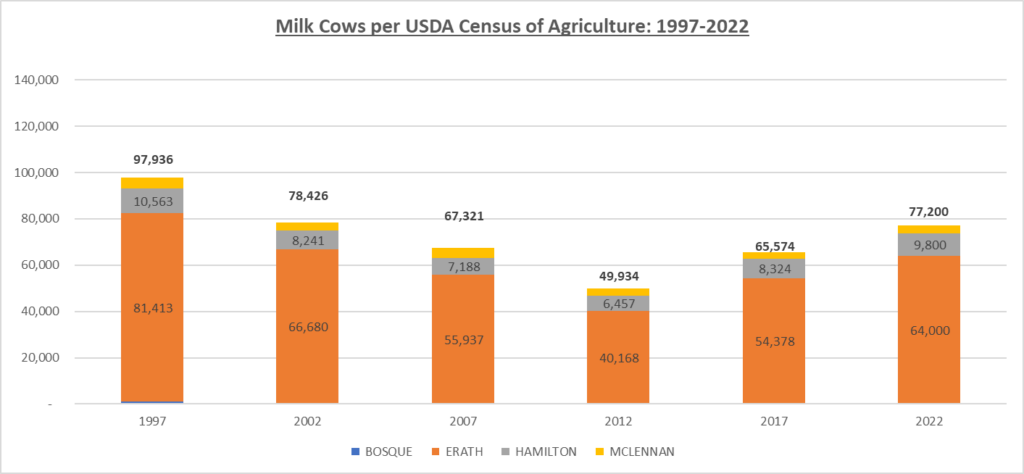
This proposed bill will drastically weaken regulations that have protected the North Bosque Watershed, Lake Waco and, in effect, the Waco Water Supply from pollution caused by dairy farms.
Background:
Prior to 2001, the Waco Water Supply was polluted as a result of dairy farmers spreading cow manure that would run off into the North Bosque River, and then into Lake Waco. This caused the growth of algae that can kill fish and made our water smell and taste bad. In 2001, the City of Waco successfully advocated for the passage of state legislation that would mandate stricter permits for dairies on the North Bosque watershed, along with waste management regulations. If you’ve been in Waco since that time, you will likely recall how poorly Waco water smelled and tasted during that time.
To date, while there has been significant improvement in the taste and smell of Waco water, the North Bosque River is still polluted and classified as impaired by the Texas Commission on Environmental Quality (TCEQ), and as recently as 2022, TCEQ said more work needs to be done on this watershed.
Proposed Legislation:
HB 2827 would revert back to a permitting system that was allowed when the pollution into the watershed was at its peak. Further, it would reduce pollution prevention, testing and reporting, thus likely increasing pollution in the North Bosque River (and thus the Waco Water Supply).
Of note, the bill’s author argues that the current law is an over-regulation. Also of note, there are nearly the same number of milk cows in the counties that touch the North Bosque watershed now as there were when the 2001 legislation was passed, and the trend indicates the number of milk cows are likely to increase. However, with of the regulations in place, Waco’s water quality has improved.
Actions the City of Waco has taken to advocate for Waco’s Water Supply:
- Communicated directly with the bill’s author, Waco’s elected State representatives, as well as the House Environmental Regulations Committee, in opposition to the bill.
- Collaborated with local stakeholders like the Greater Waco Chamber of Commerce and Baylor University.
- Engaged and informed families who own property along the North Bosque River to ensure they able to advocate appropriately.
- Sent information the Bosque River Coalition membership.
- Sent information to the Brazos River Authority.
- Engaged the EPA and TCEQ.
- Engaged with other current and former local leaders and requesting advocacy for the Texas Legislature to oppose the passage of HB2827, or ensure there are drastic amendments made that protect the Waco Water Supply from harmful dairy farm pollution.
Citizens with opposition to or concerns about HB 2827 can contact Rep. Anderson and Sen. Birdwell:
- Doc Anderson [email protected]
- Brian Birdwell [email protected]
About the City of Waco and Lake Waco:
Lake Waco is a man-made reservoir located on the west side of Waco, in McLennan County, Texas. The City of Waco maintains the water rights to Lake Waco, which serves as the primary water source Waco as well as other cities including Bellmead,Hewitt, Robinson, Woodway and others. The City of Waco owns and operates water treatment facilities and is responsible for treating the water from the lake to make it safe for drinking and other uses.
By Jeremy Rhodes
The first wave of data releases from the 2020 US Census is here, and many of the demographic shifts that we’ve seen across the country and the state are mirrored in our Waco community. In this series of posts, I am presenting some of the demographic changes we see in McLennan County from 2010 to 2020.
The first post presented numbers regarding general population growth and decline. The second post showed an overview of racial and ethnic changes in the county. The third post expanded on the racial/ethnic changes in McLennan County since 2010. In this post, we will look at some of the changes to the housing landscape in Waco since 2010.
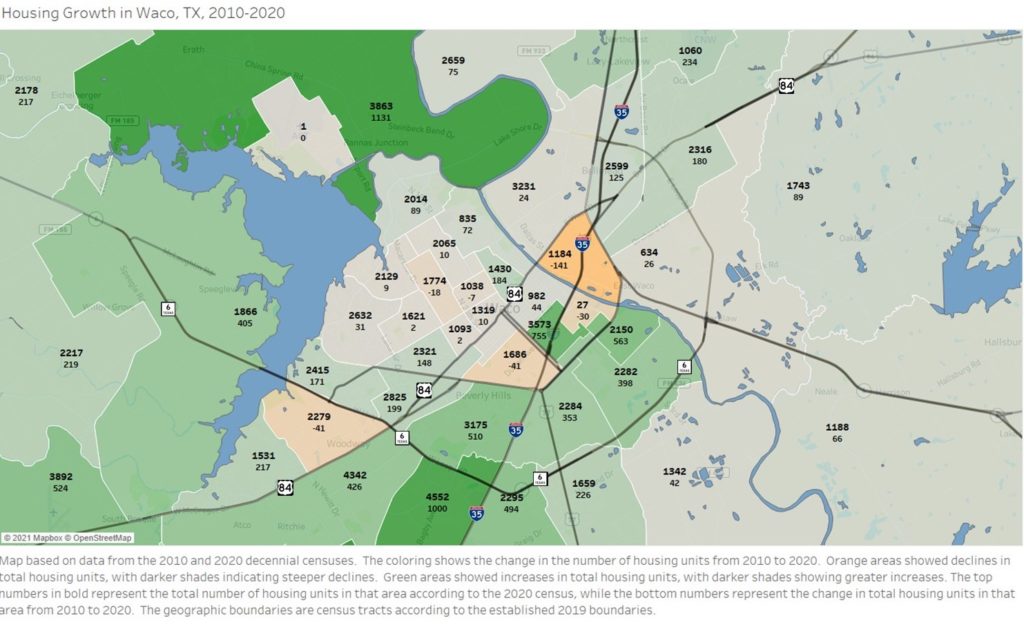
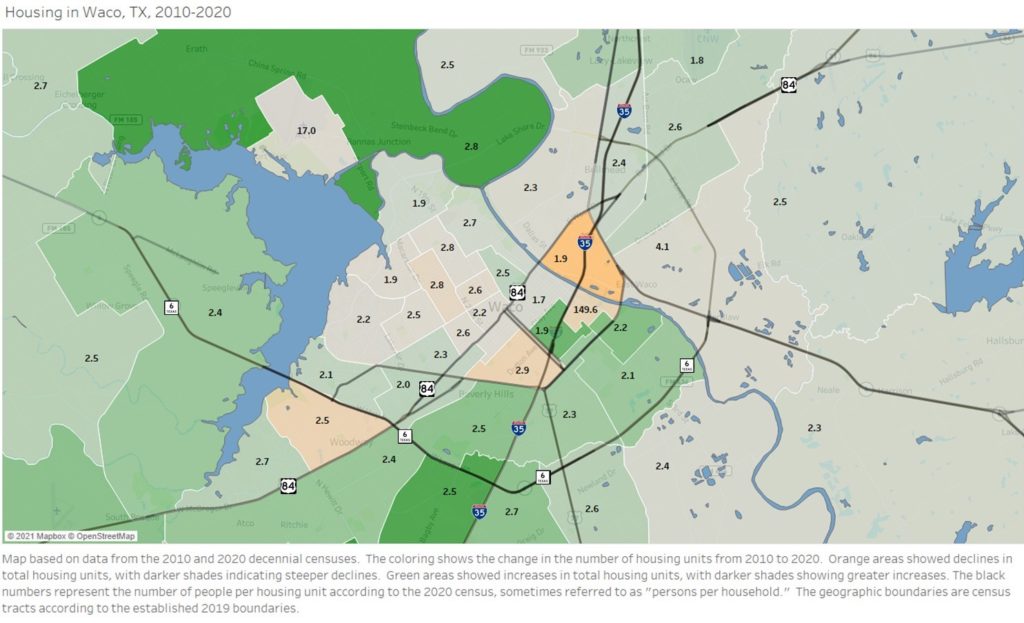
This first map shows the number of housing units in each area, as well as the change in housing units since 2010. The orange areas saw a decline in total housing units, with darker shades indicating a larger decline. The green areas saw an increase in total housing units, with darker shades indicating a larger increase. The top number shows the total number of housing units in that area, while the bottom number shows the change in number of housing units since 2010.
Most of central Waco and north Waco saw little change in total number of housing units from 2010 to 2020. The largest growth in housing units was seen in China Spring, with an addition of 1131 housing units, and Hewitt, with an addition of 1,000 units. Only six census tracts saw declines in the number of housing units since 2010. One of the historic East Waco tracts (tract 15) saw the largest decline in housing units, with a loss of 141 households. Most of the county saw moderate to robust housing growth.
The second map is similar to the first. The coloring is the same, with green shades indicating growth in housing units since 2010, and orange shades indicating decline in housing units since 2010. The black number in each tract is different in this map; it displays the number of residents per household in that area. Most of the county has between two and three people per household. Notable exceptions include downtown Waco and historic East Waco, where there are fewer than two residents per housing unit.
There are two outlier tracts that should be explained. In the northwest of the map, you will see a tract with 17 people per household. That tract is the airport, and we should not think too much about housing and population data for that tract. The other outlier is the tract containing Baylor University, which has a “persons per household” of 149.6. Although the Census Bureau does not consider dorms to be housing units, I cannot be certain how they obtained such a high number while excluding dorms from consideration.
If you have any questions about this, or if you would like Jeremy to give an overview of these changes to your group, staff, or organization through Zoom or in person, please contact Jeremy Rhodes at [email protected].
Jeremy Rhodes, Ph.D., is director of research and community impact for Prosper Waco.
The Act Locally Waco blog publishes posts with a connection to these aspirations for Waco. If you are interested in writing for the Act Locally Waco Blog, please email Ferrell Foster at [email protected].
By Jeremy Rhodes
The first wave of data releases from the 2020 US Census is here, and many of the demographic shifts that we’ve seen across the country and the state are mirrored in our Waco community. In this series of posts, I will present some of the demographic changes we see in McLennan County from 2010 to 2020.
The first post presented numbers regarding general population growth and decline. The second post showed an overview of racial and ethnic changes in the county. This post will expand on the racial/ethnic changes in McLennan County since 2010.
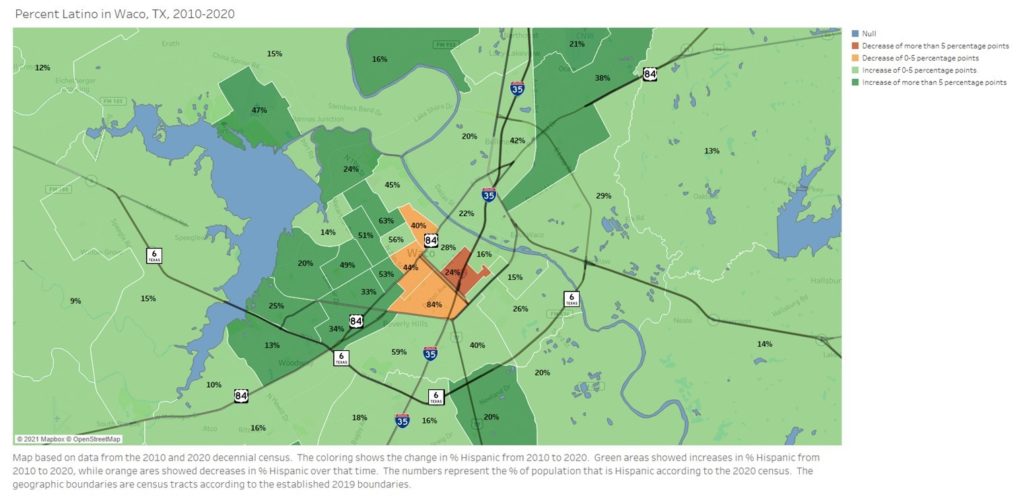
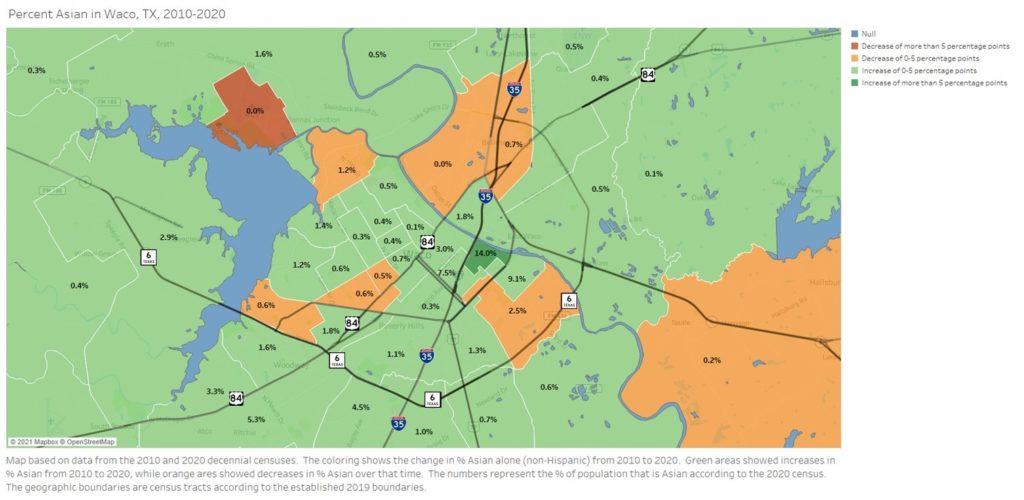
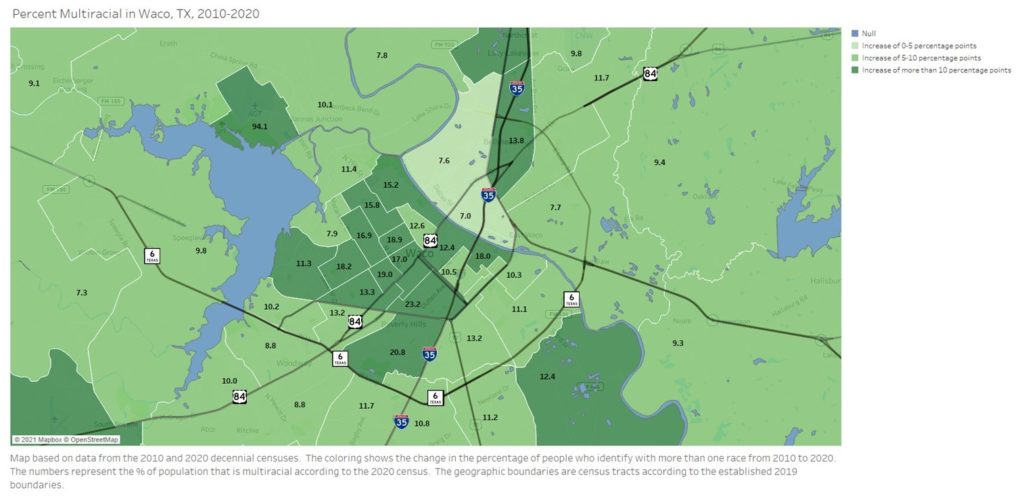
I made a series of maps that show us which parts of Waco have experienced growth and decline for some of the major racial and ethnic groups from 2010-2020, using census tract boundaries. For each of these maps, the orange areas showed decline for that group, while the green areas showed increases for that group. The black numbers represent the percentage of the residents in that tract who identify with that racial or ethnic group, according to 2020 census numbers.
As I mentioned in the previous post, the Census Bureau advises caution when comparing the racial and ethnic composition of 2010 to that of 2020. According to their website, “data comparisons between the 2020 Census and 2010 Census race data should be made with caution, taking into account the improvements we have made to the Hispanic origin and race questions and the ways we code what people tell us.”
The first map shows us Waco’s Latino population. Almost the entire map is green, indicating numerical growth in almost every census tract. “Percent Latino” declined in 4 census tracts, but increased everywhere else in the county. Even areas with a relatively small Latino population, such as China Spring, Speegleville, Woodway, and Hewitt, showed increases.
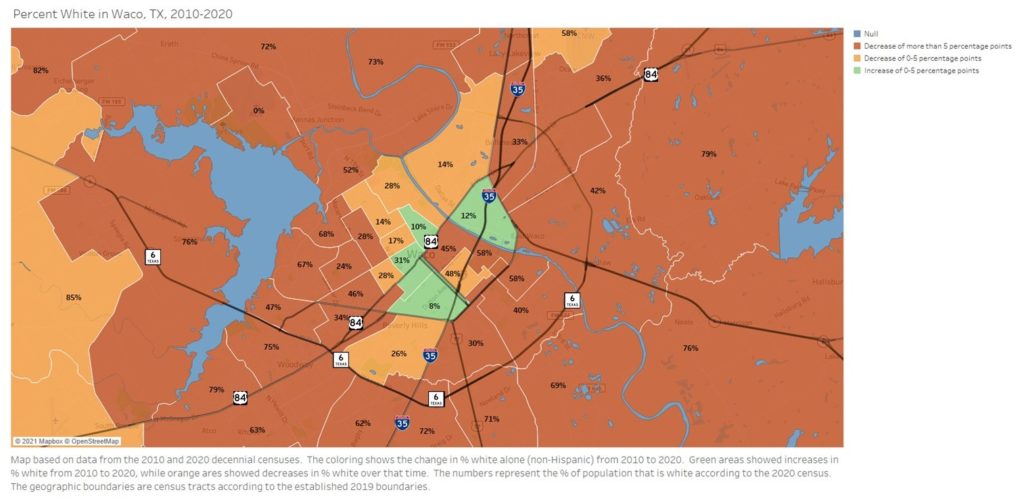
The next map shows Waco’s population who identify as White alone, non-Hispanic. It’s almost the complete opposite of the Hispanic map. Whereas the map of Latinos is almost entirely green, the map of Whites is almost entirely orange. Four census tracts in the interior of Waco show modest increases in percentage of the population that is White, but those are all tracts that already have a low percentage of Whites.
Everywhere else in the county shows declines in percentage of the population that is White. It should be noted that the orange areas do not necessarily represent a decline in the number of White people in that area, just a decline in the percentage of the population that is White. Many of the orange areas on each of these maps have more people in them from those groups, just a lower share of the population. It should also be noted that most of the orange areas on this map are a dark orange, indicating a decline of more than 5 percentage points since 2010.
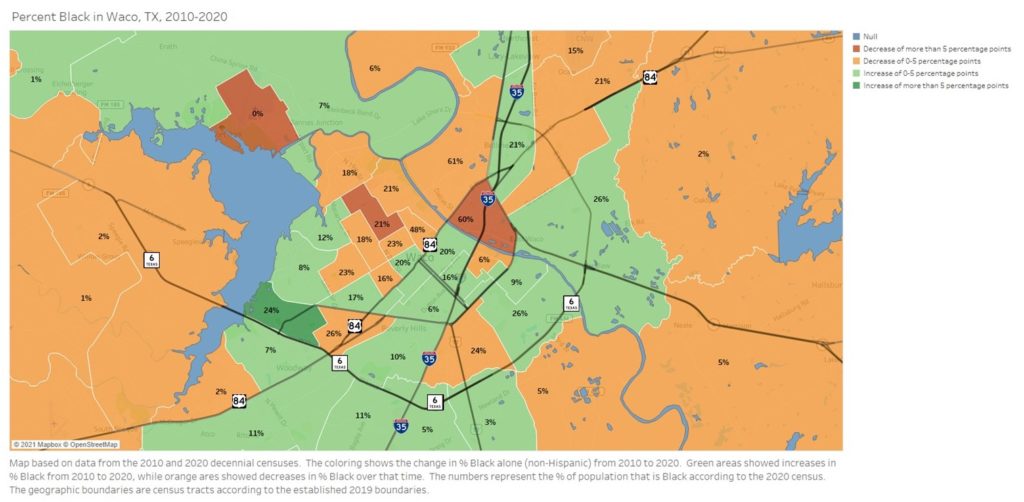
The next map shows the growth and distribution of Black residents in Waco who identify as only Black, non-Hispanic. Unlike the maps for Latinos and Whites, this map shows a mixed story. The tracts are split evenly between those that show growth in percentage Black and those that show decline. East Waco showed a decline in percentage Black, but these areas are still the places in Waco with the highest percentage of African Americans.
The next map shows the growth and distribution of Asians in Waco, which includes folks who identify with East Asian cultures such as those of China and Korea, Southeast Asian cultures such as those of Vietnam and Indonesia, and South Asian cultures such as those of India and Pakistan. Similar to the story for Latinos, most of Waco has seen an increase in the percentage of residents who identify as Asian. Most of the areas of Central Waco have seen modest increases in percent Asian, though the numbers remain small. In most Waco census tracts, less than 2% of the residents are Asian. The notable exceptions include areas near Baylor University, and the Hewitt/Woodway areas.
The final map shows the percentage of Waco residents who identify with more than one racial identity. All areas have shown growth, and the shade of green shows the amount of growth for that census tract. The areas with the darkest shade of green, mostly within the city limits, have each seen increases of at least 10 percentage points. As I mentioned in the previous post, the increase in multiracial people is caused by 3 reasons.
- Improvements in the census questions allow for a more accurate count
- Reduced stigma for interracial couples has led to more pairings, and more biracial children
- Interracial people are more willing to identify as such than in the past
If you have any questions about this, or if you would like Jeremy to give an overview of these changes to your group, staff, or organization through Zoom or in person, please contact Jeremy Rhodes at [email protected].
Jeremy Rhodes, Ph.D., is director of research and community impact for Prosper Waco.
The Act Locally Waco blog publishes posts with a connection to these aspirations for Waco. If you are interested in writing for the Act Locally Waco Blog, please email Ferrell Foster at [email protected].
By Jeremy Rhodes
The first wave of data released from the 2020 US Census is here, and many of the demographic shifts that we’ve seen across the country and the state are mirrored in our Waco community. In this series of posts, I am presenting some of the demographic changes we see in our county from 2010 to 2020. The first post presented numbers regarding general population growth and decline. This second post will show an overview of racial and ethnic changes in the county.
The census website advises caution when comparing the racial and ethnic composition of 2010 to that of 2020. According to their website, “data comparisons between the 2020 Census and 2010 Census race data should be made with caution, taking into account the improvements we have made to the Hispanic origin and race questions and the ways we code what people tell us.”
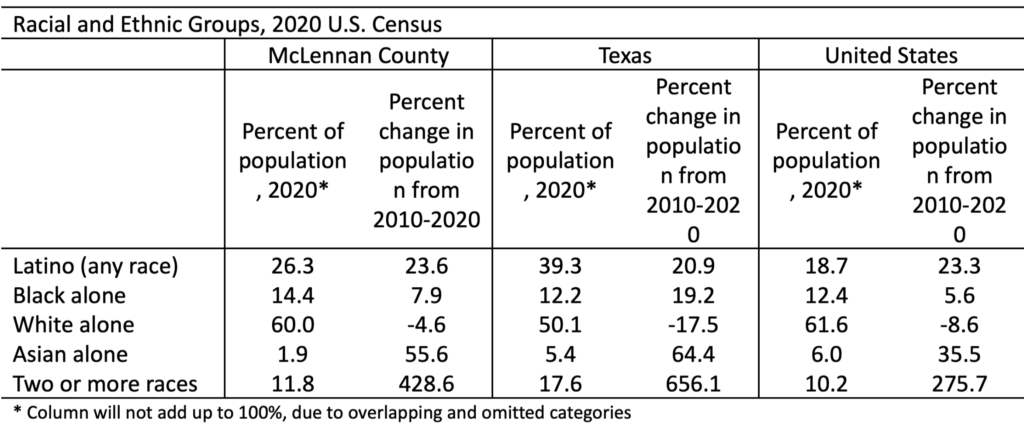
With that caveat in mind, from 2010 to 2020, the U.S. saw the most dramatic growth among two racial and ethnic groups: Latinos and multiracial people. The U.S. saw a 23% increase in Latinos, while the state of Texas saw a 21% increase in Latinos. In McLennan County, the Latino population increased by 23.6%, or an addition of 13,116 people. Multiracial Americans also saw significant growth throughout much of the United States. In McLennan County, multiracial people now make up 11.8% of the population, which is an increase of 428.6%.
The following table shows a more detailed racial and ethnic makeup for the county, in comparison to Texas and the entire U.S.
The tremendous growth of multiracial people is caused by multiple factors. The most obvious factor has to do with lessening stigma against interracial relationships. As we come to see more and more interracial pairings, we will have more biracial children being born.
Second, the Census Bureau has improved the way they ask the race/ethnicity question by creating two separate questions for race and ethnicity, which experts believe will provide a more accurate portrait of how people identify (this change is expected to also improve our count of Latinos in America).
Third, there is evidence that multiracial individuals are more willing to identify as such than in the past. For example, a person who has one Black parent and one Latino parent is now less likely to choose between those two identities, and more likely to identify as both.
The next post in this series will display maps that show where we have seen the growth and decline for specific racial/ethnic groups in Waco. If you have any questions about this, or if you would like Jeremy to give an overview of these changes to your group, staff, or organization through Zoom or in person, please contact Jeremy Rhodes at [email protected].

Jeremy Rhodes, Ph.D., is director of research and community impact for Prosper Waco.
The Act Locally Waco blog publishes posts with a connection to these aspirations for Waco. If you are interested in writing for the Act Locally Waco Blog, please email Ferrell Foster at [email protected].
By Jeremy Rhodes
The first wave of data releases from the 2020 US Census is here, and many of the demographic shifts that we’ve seen across the country and the state are mirrored in our Waco community. In this series of four posts, I will present some of the demographic changes we see in McLennan County from 2010 to 2020. This first post will be an overview of the changes in the data reported by the U.S. Census Bureau.
In all, McLennan County saw an increase of 10.9% from 2010 to 2020. The county added an additional 25,673 residents, with a 2020 population of 260,579. Of the McLennan County residents, 53.1%, or 138,486 people, live in the city of Waco. This rate of growth is lower than the Texas growth rate of 15.9%, but higher than the total U.S growth rate of 7.4%.
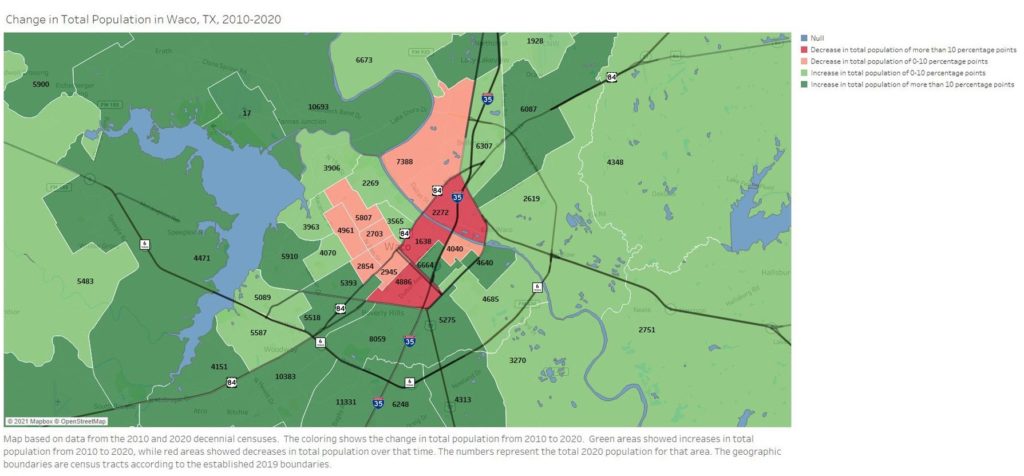
The map shows where we saw growth and decline in McLennan County from 2010-2020. The coloring shows the change in total population. Green areas showed increases in total population, while red areas showed decreases. The numbers represent the total 2020 population for that area. The geographic boundaries are census tracts according to the established 2019 boundaries.
The highest growth rates appear along the outskirts of the Waco city limits, in communities such as China Spring, Speegleville, Woodway, Hewitt, Robinson, and Bellmead. Areas that saw population decline over this time include East Waco, downtown Waco, and the 10 to 15 blocks on either side of the 25th/26th St. corridor, running from I-35 in the southeast to Park Lake Dr. in North Waco. Those areas are also characterized by lower populations than the rest of the city.
In the next posts, we will begin exploring the changing racial and ethnic dynamics of McLennan County. If you have any questions about this, or if you would like Jeremy to give an overview of these changes to your group, staff, or organization through Zoom or in person, please contact Jeremy Rhodes at [email protected].
Jeremy Rhodes, Ph.D., is director of research and community impact for Prosper Waco.
The Act Locally Waco blog publishes posts with a connection to these aspirations for Waco. If you are interested in writing for the Act Locally Waco Blog, please email Ferrell Foster at [email protected].