
By Jeremy Rhodes
The first wave of data releases from the 2020 US Census is here, and many of the demographic shifts that we’ve seen across the country and the state are mirrored in our Waco community. In this series of posts, I will present some of the demographic changes we see in McLennan County from 2010 to 2020.
The first post presented numbers regarding general population growth and decline. The second post showed an overview of racial and ethnic changes in the county. This post will expand on the racial/ethnic changes in McLennan County since 2010.
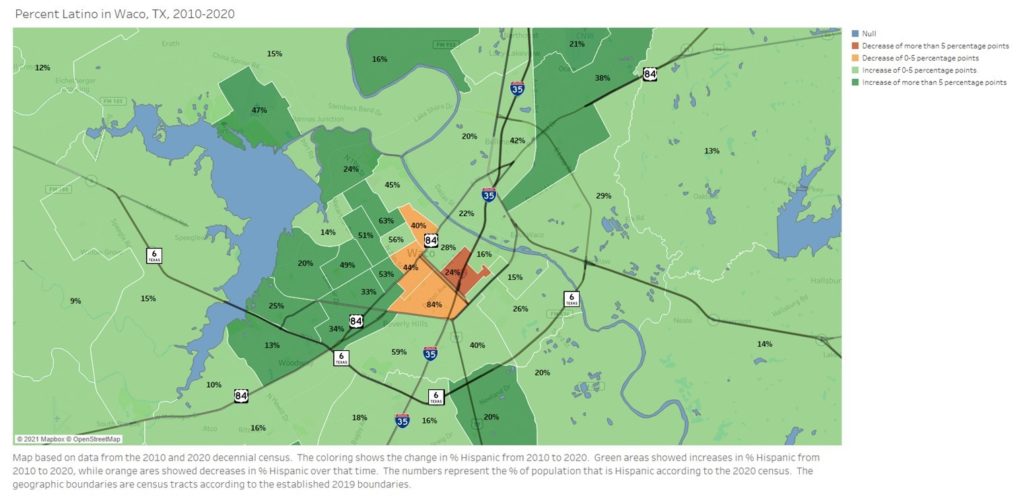
I made a series of maps that show us which parts of Waco have experienced growth and decline for some of the major racial and ethnic groups from 2010-2020, using census tract boundaries. For each of these maps, the orange areas showed decline for that group, while the green areas showed increases for that group. The black numbers represent the percentage of the residents in that tract who identify with that racial or ethnic group, according to 2020 census numbers.
As I mentioned in the previous post, the Census Bureau advises caution when comparing the racial and ethnic composition of 2010 to that of 2020. According to their website, “data comparisons between the 2020 Census and 2010 Census race data should be made with caution, taking into account the improvements we have made to the Hispanic origin and race questions and the ways we code what people tell us.”
The first map shows us Waco’s Latino population. Almost the entire map is green, indicating numerical growth in almost every census tract. “Percent Latino” declined in 4 census tracts, but increased everywhere else in the county. Even areas with a relatively small Latino population, such as China Spring, Speegleville, Woodway, and Hewitt, showed increases.
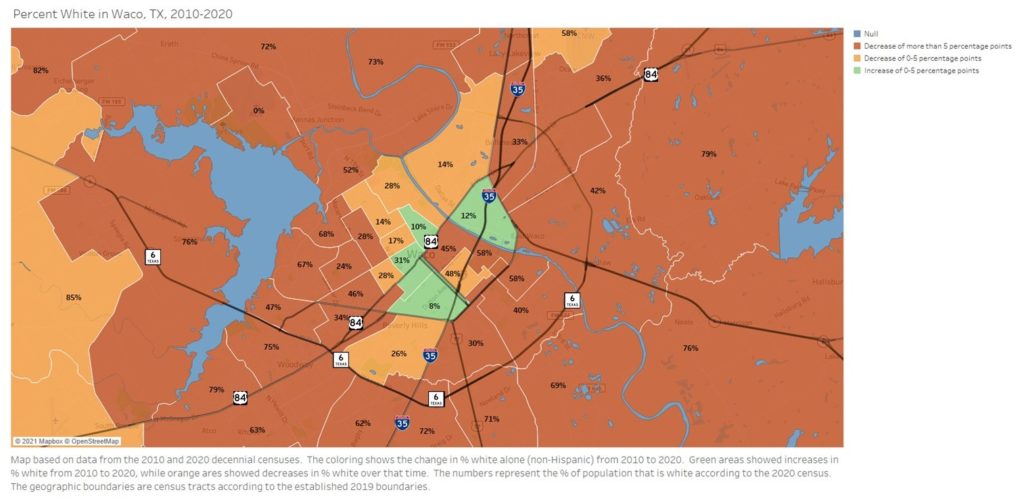
The next map shows Waco’s population who identify as White alone, non-Hispanic. It’s almost the complete opposite of the Hispanic map. Whereas the map of Latinos is almost entirely green, the map of Whites is almost entirely orange. Four census tracts in the interior of Waco show modest increases in percentage of the population that is White, but those are all tracts that already have a low percentage of Whites.
Everywhere else in the county shows declines in percentage of the population that is White. It should be noted that the orange areas do not necessarily represent a decline in the number of White people in that area, just a decline in the percentage of the population that is White. Many of the orange areas on each of these maps have more people in them from those groups, just a lower share of the population. It should also be noted that most of the orange areas on this map are a dark orange, indicating a decline of more than 5 percentage points since 2010.
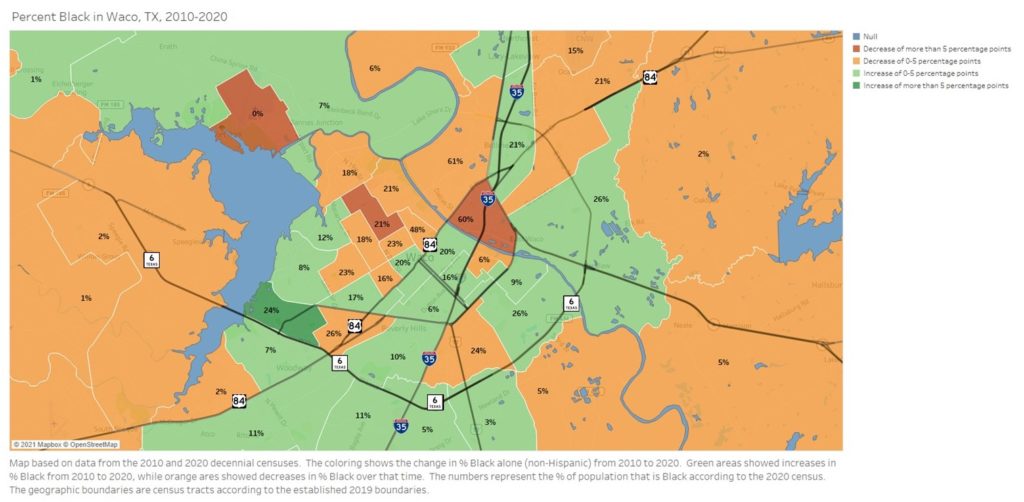
The next map shows the growth and distribution of Black residents in Waco who identify as only Black, non-Hispanic. Unlike the maps for Latinos and Whites, this map shows a mixed story. The tracts are split evenly between those that show growth in percentage Black and those that show decline. East Waco showed a decline in percentage Black, but these areas are still the places in Waco with the highest percentage of African Americans.
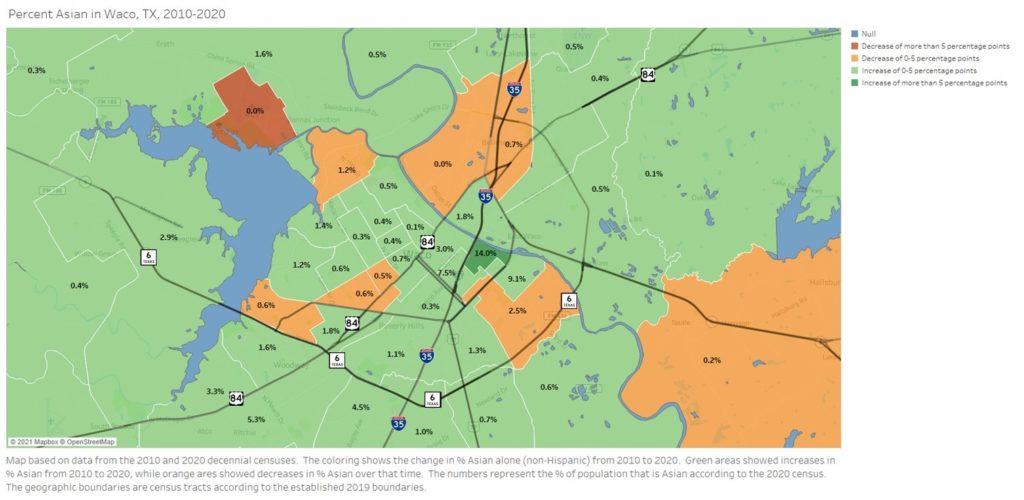
The next map shows the growth and distribution of Asians in Waco, which includes folks who identify with East Asian cultures such as those of China and Korea, Southeast Asian cultures such as those of Vietnam and Indonesia, and South Asian cultures such as those of India and Pakistan. Similar to the story for Latinos, most of Waco has seen an increase in the percentage of residents who identify as Asian. Most of the areas of Central Waco have seen modest increases in percent Asian, though the numbers remain small. In most Waco census tracts, less than 2% of the residents are Asian. The notable exceptions include areas near Baylor University, and the Hewitt/Woodway areas.
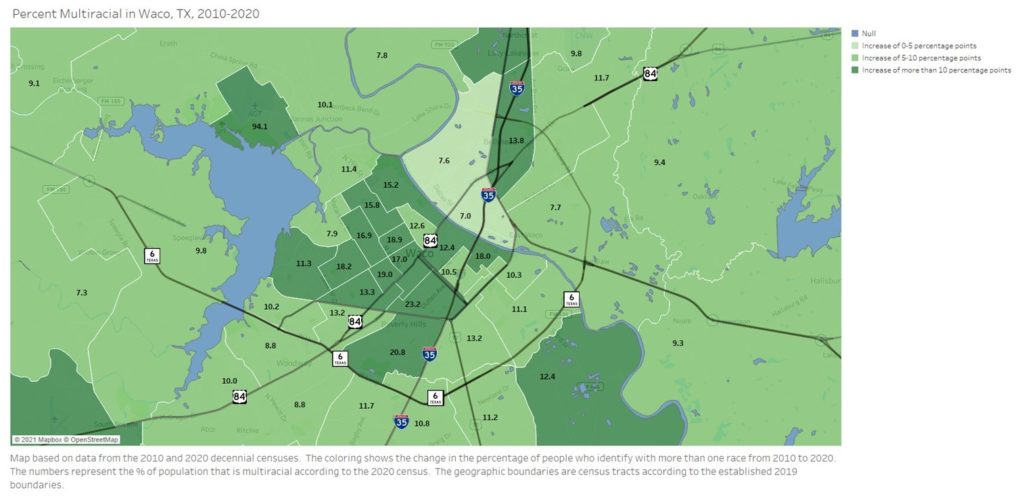
The final map shows the percentage of Waco residents who identify with more than one racial identity. All areas have shown growth, and the shade of green shows the amount of growth for that census tract. The areas with the darkest shade of green, mostly within the city limits, have each seen increases of at least 10 percentage points. As I mentioned in the previous post, the increase in multiracial people is caused by 3 reasons.
- Improvements in the census questions allow for a more accurate count
- Reduced stigma for interracial couples has led to more pairings, and more biracial children
- Interracial people are more willing to identify as such than in the past
If you have any questions about this, or if you would like Jeremy to give an overview of these changes to your group, staff, or organization through Zoom or in person, please contact Jeremy Rhodes at [email protected].
Jeremy Rhodes, Ph.D., is director of research and community impact for Prosper Waco.
The Act Locally Waco blog publishes posts with a connection to these aspirations for Waco. If you are interested in writing for the Act Locally Waco Blog, please email Ferrell Foster at [email protected].